Hallo,
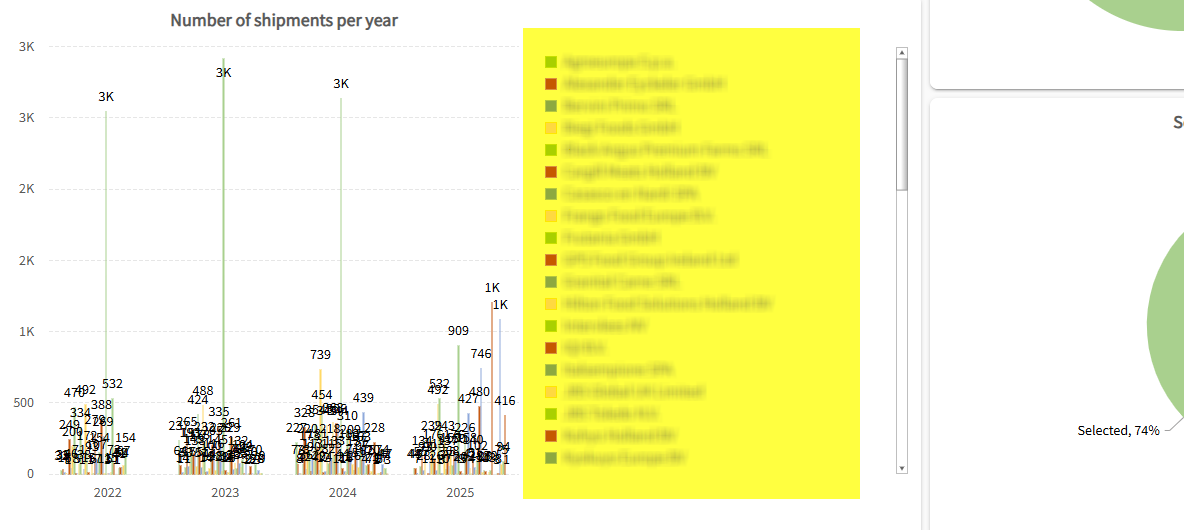
I'd like to ask for any suggestions. We're creating a cube chart to represent Company, Volume/Number of Shipments, and Year.
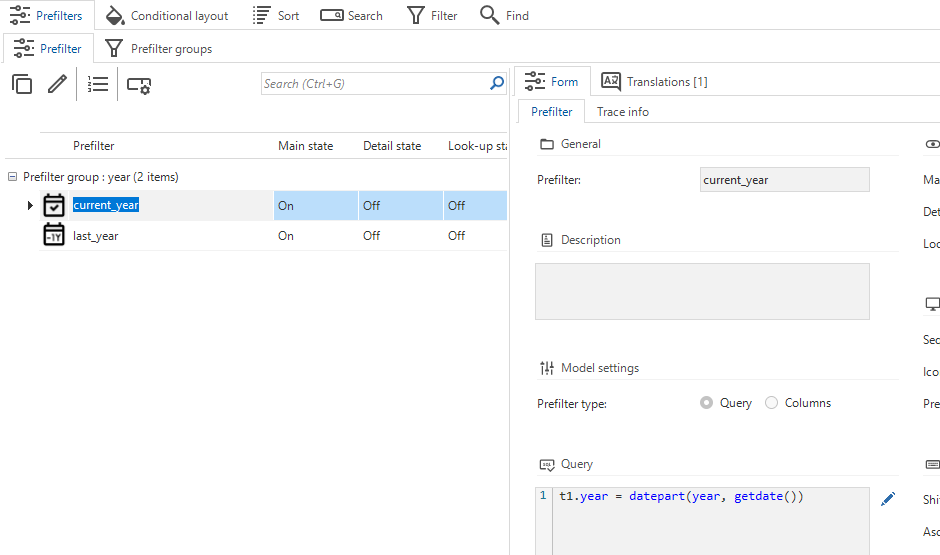
Is it possible not to display all values by default when the page loads? We'd like to add filters, such as by Company or Year, instead of showing everything at once.
Right now, the chart displays all company values, and it looks cluttered. If there's a way to apply filters, that would really help with clarity.
This chart will be one of the key items on our dashboard, so we need it to provide statistical insights into shipment volume.