


Context
I’m trying to create a grid that contains rows with prognosis, values and totals. Based on a contract-number. The idea is to be able to quickly gain insight into specific contracts prognosis, values and totals.
Example:
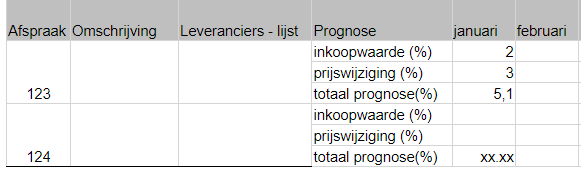
What do I want?
Group on afspraak, omschrijving and leveranciers (all belong to contract), each contract has 3 rows of prognosis (inkoopwaarde, prijswijziging and total) each with its corresponding months.
Datastructure:
Its all one table in 1NF (supplier list is a description and has no relation and is not intended to).
What did I try?
I’ve tried working with the group untill function in the subjects, however as soon as Im adding more groups (for omschrijving and leverancier) the grid changes to a triple hierarchy tree-like view. Thats not what I want.
When is problem solved?
When I can make a grid in software factory that is like the example in context.
Any suggestion is welcome and appreciated. Thanks in advance.
