


We would like to show some data in a Gauge format. (Speedometer) like
https://docs.microsoft.com/en-us/windows/communitytoolkit/controls/radialgauge
or https://blogs.u2u.be/diederik/post/A-Radial-Gauge-for-Universal-Windows-Apps
Open
Add gauges to graph
Related products:Software FactoryWindows GUIUniversal GUI
- June 24, 2019
- 6 replies
- 161 views
Did this topic help you find an answer to your question?
6 replies

 +6
+6- Warrior
- 33 replies
- June 25, 2019

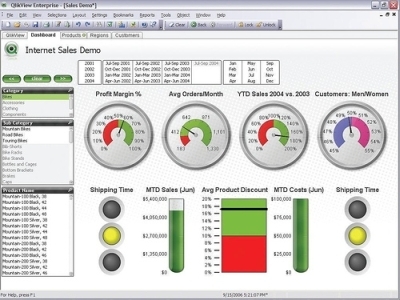
In terms of BI we can make some cool stuff already, but I agree with you this could be Improved. It would be cool to have the possibility to actually make dashboards like this: (Clikview example)
- Captain
- 116 replies
- December 18, 2023

As long as there is no native solution, you can create your own Gauge meters. Just like the 5 star ranking in the SF, you can create a function that dynamically builds a SVG file.
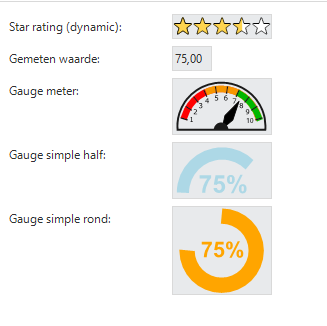
The simple Gauge meter functions have the percentage and color as parameters and use only a few lines of SVG-code.

 +4
+4- Captain
- 42 replies
- January 24, 2025
And I guess this is only possible in Universal GUI ?
- Captain
- 116 replies
- January 27, 2025
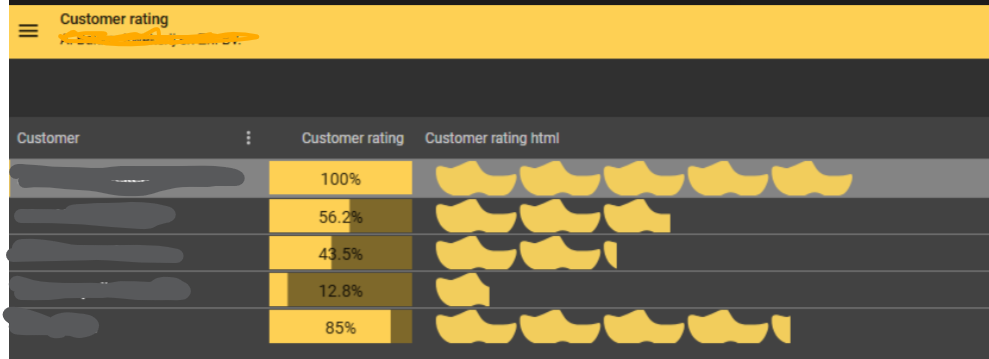
It works the same as the 5-star ranking in the Software Factory (Windows GUI, see Thinkstore).
You need 2 columns:
- A hidden column with icon data (varbinary(max)).
- A read only column with a domain using an image upload control.
This column uses the first column as storage column.
To fill the icon data (expression or in a view) you can use one of the functions below. This first creates a simple Gauge in the color specified. The second function moves the pointer based on the percentage specified.
I'm not a SVG specialist, so if it can be done easier, let in know.
create or alter function "get_gauge_circle_icon"
(
   @percentage   "whole_no"      ,
   @color        "description"
)
returns "icon_data"
as
begin


    --control_proc_id:      get_gauge_circle_icon
    --template_id:          get_gauge_circle_icon
    --prog_object_item_id:  get_gauge_circle_icon
    --template_description:

    return (select
               cast(concat('<?xml version="1.0" encoding="UTF-8" standalone="no"?>
               <svg id="Meter" xmlns="http://www.w3.org/2000/svg" viewBox="0 0 40 40" width="40" height="40">
                  <path id="circle" d="m 19.999864,4.084371 a 15.9155,15.9155 0 0 1 0,31.831 15.9155,15.9155 0 0 1 0,-31.831" fill="none" stroke="', @color, '" stroke-width="7" stroke-dasharray="', t1.percentage, ', 100"/>
                  <text text-anchor="middle" x="20" y="23" font="arial" font-size="10px" font-weight="bold" text-align="center" fill="', @color, '">', t1.percentage, '%</text>
               </svg>')
               as varbinary(max))
               from (select case when @percentage < 0 then 0
                                 when @percentage > 100 then 100
                                 else @percentage
                                 end as percentage) t1
                                 )


end
go
create or alter function "get_dashboard_icon"
(
@percentage "percentage"
)
returns "icon_data"
as
begin
--control_proc_id: get_dashboard_icon
--template_id: get_dashboard_icon
--prog_object_item_id: get_dashboard_icon
--template_description:
-- Returns a dashboard icon with a pointer based on the percentage provided to the function
return cast(concat('<?xml version="1.0" encoding="UTF-8" standalone="no"?>
<svg
width="150mm"
height="80mm"
viewBox="0 0 150 80"
version="1.1"
id="svg300"
sodipodi:docname="dashboard_base_test.svg"
inkscape:version="1.2.2 (732a01da63, 2022-12-09)"
xmlns:inkscape="http://www.inkscape.org/namespaces/inkscape"
xmlns:sodipodi="http://sodipodi.sourceforge.net/DTD/sodipodi-0.dtd"
xmlns="http://www.w3.org/2000/svg"
xmlns:svg="http://www.w3.org/2000/svg">
<sodipodi:namedview
id="namedview302"
pagecolor="#ffffff"
bordercolor="#666666"
borderopacity="1.0"
inkscape:showpageshadow="2"
inkscape:pageopacity="0.0"
inkscape:pagecheckerboard="0"
inkscape:deskcolor="#d1d1d1"
inkscape:document-units="mm"
showgrid="false"
inkscape:zoom="0.55827083"
inkscape:cx="-55.528604"
inkscape:cy="686.04695"
inkscape:window-width="1680"
inkscape:window-height="987"
inkscape:window-x="-8"
inkscape:window-y="-8"
inkscape:window-maximized="1"
inkscape:current-layer="layer2" />
<g
inkscape:groupmode="layer"
id="layer2"
inkscape:label="Pointer">
<polygon points="75,75 55,82 25,75 55,68" style="fill:black;stroke:black;stroke-width:1" transform ="rotate(',
case when @percentage <= 0 then 0
when @percentage >= 100 then 162
else (@percentage * 162)/ 100
end , ' 75 75)" />
</g>
<g
inkscape:label="Dashboard"
inkscape:groupmode="layer"
id="layer1"
transform="translate(-185.73872,-83.005661)">
<g
id="g1672"
transform="translate(-25.118482,24.644551)">
<path
id="path4157"
style="fill:none;stroke:#ff0000;stroke-width:9.99998;stroke-linecap:square;stroke-miterlimit:10;stroke-dashoffset:3.7162;paint-order:markers stroke fill"
d="m 228.3457,113.38039 a 58.709881,58.709881 0 0 1 56.17326,-41.638988 58.709881,58.709881 0 0 1 56.53437,42.875868" />
<path
id="path1392"
style="fill:none;stroke:#f79600;stroke-width:9.99998;stroke-linecap:square;stroke-miterlimit:10;stroke-dasharray:none;stroke-dashoffset:3.7162;stroke-opacity:1;paint-order:markers stroke fill"
d="m 266.12874,75.067705 c 7.30874,-3.132738 10.43838,-3.326302 18.39022,-3.326303 7.86272,-10e-7 15.64534,1.579363 22.88606,4.644377"
sodipodi:nodetypes="csc" />
<path
id="path1387"
style="fill:none;stroke:#00b700;stroke-width:9.99996;stroke-linecap:square;stroke-miterlimit:10;stroke-dasharray:none;stroke-dashoffset:3.7162;stroke-opacity:1;paint-order:markers stroke fill"
d="m 313.51126,79.766306 c 12.14223,6.065653 24.22966,22.881004 28.54277,35.781364"
sodipodi:nodetypes="cc" />
<path
id="path4127"
style="color:#000000;fill:#1a1a1a;stroke-width:1;stroke-linecap:square;stroke-miterlimit:10;stroke-dashoffset:3.7162;-inkscape-stroke:none;paint-order:markers stroke fill"
d="m 276.63815,67.531192 -2.0558,0.310163 0.14604,1.074909 1.29876,9.446056 0.14604,1.076594 2.05796,-0.310174 -0.14819,-1.074343 -1.29662,-9.446045 z m 16.5989,0 -0.14765,1.07716 -1.29716,9.446045 -0.14765,1.074343 2.05527,0.310174 0.14818,-1.076594 1.29877,-9.446056 0.14604,-1.074909 z m -34.57817,5.245869 -1.88881,0.902403 0.43219,0.989509 3.7841,8.675689 0.43221,0.989498 1.88936,-0.904653 -0.43006,-0.989499 -3.78678,-8.675689 z m 52.55743,0 -0.4322,0.987258 -3.78678,8.675689 -0.43006,0.989499 1.88937,0.904653 0.4322,-0.989498 3.78463,-8.675689 0.43221,-0.989509 z m -68.44224,10.249 -1.57043,1.424977 0.67971,0.822049 5.97412,7.211948 0.67972,0.822059 1.57045,-1.423291 -0.68187,-0.821494 -5.97197,-7.214188 z m 84.32705,0 -0.67971,0.82206 -5.97197,7.214188 -0.68187,0.821494 1.57043,1.423291 0.67973,-0.822059 5.97411,-7.211948 0.68027,-0.822049 z m -96.74399,14.575047 -1.12429,1.830663 0.87462,0.586049 7.66859,5.16047 0.87461,0.58605 1.12212,-1.82841 -0.87246,-0.5883 -7.66858,-5.158218 z m 109.16095,0 -0.87462,0.588304 -7.66858,5.158218 -0.87246,0.5883 1.12212,1.82841 0.87461,-0.58605 7.66859,-5.16047 0.87462,-0.586049 z m -117.17048,17.648072 -0.58629,2.0852 0.99648,0.30567 8.74615,2.68867 0.99595,0.30624 0.58685,-2.088 -0.99865,-0.30568 -8.744,-2.68642 z m 125.18,0 -0.99649,0.30568 -8.74401,2.68642 -0.9981,0.30568 0.5863,2.088 0.99649,-0.30624 8.74561,-2.68867 0.9965,-0.30567 z" />
<path
style="fill:none;stroke:#1a1a1a;stroke-width:3;stroke-linecap:square;stroke-miterlimit:10;stroke-dasharray:none;stroke-dashoffset:3.7162;paint-order:markers stroke fill"
d="m 284.78778,62.204712 c -1.68848,-6.2e-5 -3.37638,0.06222 -5.06015,0.186689 -1.6839,0.124523 -3.36249,0.311173 -5.03225,0.559559 -3.34079,0.497136 -6.63921,1.240358 -9.86762,2.22344 -3.22821,0.982877 -6.37738,2.202825 -9.42113,3.649625 -1.52139,0.72318 -3.01485,1.502279 -4.47724,2.33566 -1.46247,0.833433 -2.89284,1.720573 -4.28811,2.659559 -5.59056,3.762216 -10.5783,8.330225 -14.79703,13.551819 -1.0528,1.303184 -2.05585,2.644782 -3.00705,4.021983 -1.90317,2.755182 -3.59478,5.647081 -5.06068,8.651474 -1.46578,3.00453 -2.70172,6.11315 -3.69745,9.29978 -1.49467,4.78255 -2.44042,9.7157 -2.81946,14.70663 -0.12612,1.66216 -0.18921,3.32841 -0.18914,4.99523 0.006,1.83443 0.088,3.66785 0.2465,5.4956 h 134.95558 c 0.0106,-0.11235 0.021,-0.22474 0.031,-0.33717 0.0448,-0.57197 0.0822,-1.14448 0.11214,-1.71743 0.0599,-1.14606 0.0899,-2.29343 0.0899,-3.441 -1.5e-4,-4.0189 -0.36751,-8.02958 -1.0976,-11.98332 -0.20838,-1.12889 -0.44617,-2.25229 -0.71314,-3.36909 -0.40053,-1.6754 -0.86648,-3.33491 -1.39681,-4.97481 -0.35355,-1.09328 -0.73557,-2.17739 -1.14567,-3.25125 -0.20507,-0.5369 -0.41713,-1.07117 -0.63614,-1.60267 -0.87605,-2.12627 -1.86248,-4.206576 -2.95537,-6.232665 -0.27317,-0.506475 -0.55294,-1.009456 -0.83923,-1.50882 -1.14545,-1.997723 -2.39441,-3.935877 -3.74189,-5.806758 -0.3369,-0.467663 -0.67989,-0.931026 -1.02888,-1.38997 -0.69781,-0.917799 -1.41945,-1.817709 -2.1642,-2.698835 -1.48965,-1.762579 -3.07028,-3.448248 -4.73563,-5.050308 -0.41633,-0.400483 -0.83788,-0.795658 -1.26452,-1.185426 -1.27982,-1.169359 -2.60494,-2.28948 -3.97237,-3.357861 -0.45585,-0.356092 -0.91632,-0.706377 -1.38131,-1.050764 -0.46496,-0.344305 -0.9344,-0.682687 -1.40819,-1.015061 -0.47373,-0.332513 -0.95177,-0.658992 -1.43402,-0.979355 -1.44698,-0.960921 -2.93103,-1.866308 -4.44882,-2.714138 -0.50573,-0.282585 -1.01513,-0.558731 -1.52807,-0.828369 -0.51314,-0.269759 -1.02977,-0.532981 -1.54978,-0.789606 -2.08024,-1.026158 -4.21265,-1.945861 -6.38876,-2.755455 -2.72031,-1.012403 -5.50385,-1.850841 -8.33334,-2.510105 -2.26336,-0.527102 -4.55273,-0.938774 -6.85901,-1.233375 -0.57651,-0.07381 -1.15395,-0.140302 -1.73219,-0.199441 -0.57825,-0.05888 -1.15725,-0.110398 -1.73685,-0.154555 -1.73876,-0.13288 -3.48207,-0.199409 -5.22604,-0.199441 z"
id="path1395" />
<path
style="fill:#1a1a1a;stroke:none;stroke-width:0.999997;stroke-linecap:square;stroke-miterlimit:10;stroke-dasharray:none;stroke-dashoffset:3.7162;stroke-opacity:1;paint-order:markers stroke fill"
id="path4212"
sodipodi:type="arc"
sodipodi:cx="284.73712"
sodipodi:cy="-134.30266"
sodipodi:rx="11.374408"
sodipodi:ry="11.848342"
sodipodi:start="0"
sodipodi:end="3.1415927"
sodipodi:arc-type="slice"
d="m 296.11153,-134.30266 a 11.374408,11.848342 0 0 1 -5.6872,10.26097 11.374408,11.848342 0 0 1 -11.37441,0 11.374408,11.848342 0 0 1 -5.68721,-10.26097 h 11.37441 z"
transform="matrix(0.99999461,0.00328316,0.00328316,-0.99999461,0,0)" />
<g
aria-label="0123456789"
id="text5189"
style="font-size:10.5833px;line-height:1.25;letter-spacing:0px;word-spacing:0px;stroke-width:0.264583"
transform="translate(-7.1090049,0.9478673)">
<path
d="m 248.34891,121.80095 h -4.1651 v -0.78548 h 1.60196 v -5.15729 h -1.60196 v -0.7028 q 0.32556,0 0.69763,-0.0517 0.37206,-0.0568 0.56327,-0.1602 0.23771,-0.12919 0.37207,-0.32556 0.13952,-0.20154 0.16019,-0.53743 h 0.80098 v 6.93495 h 1.57096 z"
id="path5257" />
<path
d="m 254.56854,109.95261 h -5.20896 v -1.08004 q 0.5426,-0.46508 1.0852,-0.93017 0.54777,-0.46509 1.01802,-0.92501 0.99218,-0.96118 1.35909,-1.52445 0.3669,-0.56844 0.3669,-1.22472 0,-0.59945 -0.39791,-0.93534 -0.39274,-0.34107 -1.1007,-0.34107 -0.47026,0 -1.01803,0.16537 -0.54777,0.16536 -1.0697,0.50642 h -0.0517 v -1.0852 q 0.36691,-0.18086 0.97669,-0.33073 0.61494,-0.14986 1.18855,-0.14986 1.18339,0 1.85518,0.57361 0.67179,0.56844 0.67179,1.54512 0,0.43925 -0.11369,0.82165 -0.10852,0.37724 -0.32556,0.7183 -0.20154,0.3204 -0.47542,0.63045 -0.26872,0.31006 -0.65629,0.6873 -0.55293,0.5426 -1.14204,1.05419 -0.58911,0.50643 -1.10071,0.94051 h 4.13927 z"
id="path5254" />
<path
d="m 262.04163,96.768744 q 0.24805,0.222208 0.40825,0.558103 0.16019,0.335896 0.16019,0.868162 0,0.527098 -0.1912,0.966346 -0.1912,0.439248 -0.53743,0.764809 -0.38757,0.361736 -0.91467,0.537436 -0.52193,0.17053 -1.14721,0.17053 -0.64079,0 -1.26091,-0.15503 -0.62011,-0.14986 -1.01802,-0.33073 v -1.080033 h 0.0775 q 0.43925,0.289388 1.03353,0.48059 0.59427,0.191202 1.14721,0.191202 0.32556,0 0.69246,-0.10852 0.3669,-0.10852 0.59428,-0.320393 0.23771,-0.227376 0.3514,-0.50126 0.11885,-0.273884 0.11885,-0.692462 0,-0.41341 -0.13436,-0.682127 -0.12919,-0.273884 -0.36173,-0.428913 -0.23254,-0.160196 -0.56327,-0.21704 -0.33073,-0.06201 -0.71313,-0.06201 h -0.46509 v -0.857826 h 0.36173 q 0.78548,0 1.25057,-0.325561 0.47025,-0.330728 0.47025,-0.961179 0,-0.279051 -0.11885,-0.485756 -0.11886,-0.211873 -0.33073,-0.346231 -0.22221,-0.134359 -0.47542,-0.186035 -0.25321,-0.05168 -0.57361,-0.05168 -0.49092,0 -1.04386,0.175699 -0.55293,0.175699 -1.04386,0.496092 h -0.0517 v -1.080034 q 0.3669,-0.180867 0.97668,-0.330728 0.61495,-0.155029 1.18856,-0.155029 0.56327,0 0.99218,0.103353 0.42891,0.103352 0.77515,0.330728 0.37206,0.248046 0.56327,0.599445 0.1912,0.351398 0.1912,0.821652 0,0.640786 -0.45475,1.121375 -0.44959,0.475422 -1.06453,0.599445 v 0.07235 q 0.24804,0.04134 0.56844,0.175699 0.32039,0.129191 0.5426,0.325561 z"
id="path5251" />
<path
d="m 272.94008,90.725758 h -1.14204 v 2.165236 h -0.99219 v -2.165236 h -3.68452 v -1.188554 l 3.72586,-4.340806 h 0.95085 v 4.70254 h 1.14204 z m -2.13423,-0.82682 v -3.472645 l -2.98172,3.472645 z"
id="path5248" />
<path
d="m 287.01356,86.181304 q 0,0.537433 -0.19637,1.028357 -0.19637,0.490925 -0.53743,0.826821 -0.37207,0.361733 -0.88883,0.558103 -0.5116,0.191202 -1.18856,0.191202 -0.63045,0 -1.21439,-0.134358 -0.58394,-0.129191 -0.98702,-0.315225 v -1.090369 h 0.0724 q 0.42375,0.268716 0.99219,0.459918 0.56843,0.186035 1.1162,0.186035 0.3669,0 0.70797,-0.103353 0.34623,-0.103352 0.61494,-0.361733 0.22738,-0.222208 0.34107,-0.532266 0.11885,-0.310058 0.11885,-0.7183 0,-0.397907 -0.13952,-0.671792 -0.13436,-0.273884 -0.37724,-0.439248 -0.26872,-0.19637 -0.65629,-0.273884 -0.3824,-0.08268 -0.85782,-0.08268 -0.45475,0 -0.8785,0.06201 -0.41858,0.06201 -0.72347,0.124023 v -3.963569 h 4.6302 v 0.904334 h -3.63285 v 2.046381 q 0.22221,-0.02067 0.45476,-0.03101 0.23254,-0.01034 0.40307,-0.01034 0.62528,0 1.09554,0.10852 0.47025,0.103352 0.86299,0.372069 0.41341,0.284219 0.64079,0.733803 0.22737,0.449583 0.22737,1.126543 z"
id="path5245" />
<path
d="m 301.50044,86.129628 q 0,1.173052 -0.77514,1.91719 -0.76998,0.73897 -1.89136,0.73897 -0.56843,0 -1.03352,-0.175699 -0.46509,-0.175699 -0.82165,-0.52193 -0.44442,-0.428913 -0.6873,-1.136878 -0.23771,-0.707965 -0.23771,-1.705317 0,-1.02319 0.21704,-1.813837 0.22221,-0.790647 0.7028,-1.405594 0.45475,-0.583942 1.17305,-0.909503 0.7183,-0.330728 1.67431,-0.330728 0.30489,0 0.5116,0.02584 0.2067,0.02584 0.41857,0.09302 v 0.987016 h -0.0517 q -0.1447,-0.07751 -0.43925,-0.144693 -0.28939,-0.07235 -0.59428,-0.07235 -1.11104,0 -1.77249,0.69763 -0.66146,0.692462 -0.76998,1.875848 0.43408,-0.263549 0.85266,-0.397907 0.42374,-0.139526 0.97668,-0.139526 0.49092,0 0.86299,0.09302 0.37724,0.08785 0.76998,0.361734 0.45475,0.315225 0.68213,0.795815 0.23254,0.480589 0.23254,1.167883 z m -1.04903,0.04134 q 0,-0.480589 -0.14469,-0.795814 -0.13953,-0.315225 -0.46509,-0.547769 -0.23771,-0.165364 -0.5271,-0.21704 -0.28938,-0.05168 -0.60461,-0.05168 -0.43925,0 -0.81648,0.103352 -0.37724,0.103353 -0.77515,0.320393 -0.0103,0.113688 -0.0155,0.222208 -0.005,0.103353 -0.005,0.263549 0,0.816485 0.16537,1.291907 0.17053,0.470254 0.46508,0.744138 0.23771,0.227376 0.5116,0.335896 0.27905,0.103352 0.60461,0.103352 0.74931,0 1.17822,-0.454751 0.42891,-0.459919 0.42891,-1.317745 z"
id="path5242" />
<path
d="m 314.77075,86.822712 -3.48298,6.542216 h -1.10587 l 3.70519,-6.790262 h -4.38215 v -0.904334 h 5.26581 z"
id="path5239" />
<path
d="m 325.32664,98.329367 q 0,0.997352 -0.78031,1.658808 -0.77515,0.661455 -1.95337,0.661455 -1.25056,0 -1.9947,-0.64595 -0.73897,-0.645955 -0.73897,-1.653643 0,-0.640785 0.37207,-1.157548 0.37207,-0.52193 1.04903,-0.82682 v -0.03101 q -0.62012,-0.330728 -0.91984,-0.723468 -0.29456,-0.392739 -0.29456,-0.981849 0,-0.868161 0.71314,-1.446935 0.71313,-0.578775 1.81383,-0.578775 1.15238,0 1.83968,0.552936 0.68729,0.552937 0.68729,1.405595 0,0.52193 -0.32556,1.028358 -0.32556,0.501259 -0.95601,0.785479 v 0.03101 q 0.72347,0.310057 1.10587,0.764808 0.38241,0.454752 0.38241,1.157549 z m -1.22473,-3.756865 q 0,-0.552936 -0.42891,-0.878496 -0.42375,-0.330728 -1.08521,-0.330728 -0.65112,0 -1.06969,0.310057 -0.41341,0.310058 -0.41341,0.837156 0,0.372069 0.2067,0.645953 0.21187,0.268717 0.63562,0.480589 0.1912,0.09302 0.54777,0.242879 0.36173,0.149861 0.70279,0.248046 0.5116,-0.341064 0.70797,-0.707965 0.19637,-0.366902 0.19637,-0.847491 z m 0.1602,3.85505 q 0,-0.475422 -0.21188,-0.759641 -0.2067,-0.289387 -0.81648,-0.578775 -0.24288,-0.113687 -0.53227,-0.211872 -0.28938,-0.09819 -0.76997,-0.273884 -0.46509,0.253213 -0.74931,0.687294 -0.27905,0.434081 -0.27905,0.981849 0,0.69763 0.48059,1.152381 0.48059,0.454751 1.21956,0.454751 0.75447,0 1.20405,-0.387572 0.45476,-0.387572 0.45476,-1.064531 z"
id="path5236" />
<path
d="m 334.83132,105.6428 q 0,1.00769 -0.23255,1.82934 -0.22737,0.82166 -0.69246,1.40043 -0.47025,0.58911 -1.17822,0.9095 -0.70796,0.3204 -1.66397,0.3204 -0.26872,0 -0.50643,-0.031 -0.23771,-0.0258 -0.42375,-0.0879 v -0.98702 h 0.0517 q 0.14986,0.0775 0.42375,0.14986 0.27388,0.0672 0.60978,0.0672 1.14204,0 1.78799,-0.68213 0.65113,-0.68729 0.75448,-1.89135 -0.48059,0.28939 -0.90434,0.41341 -0.42374,0.12403 -0.925,0.12403 -0.47542,0 -0.863,-0.093 -0.3824,-0.093 -0.76997,-0.36174 -0.45475,-0.31522 -0.6873,-0.80098 -0.22737,-0.48576 -0.22737,-1.16272 0,-1.17822 0.77514,-1.91719 0.77515,-0.73897 1.89135,-0.73897 0.55811,0 1.03353,0.1757 0.47542,0.17053 0.83199,0.51677 0.43924,0.42891 0.67696,1.10587 0.23771,0.67179 0.23771,1.74149 z m -1.04386,-0.2222 q 0,-0.80099 -0.16537,-1.28674 -0.16536,-0.48576 -0.45475,-0.75448 -0.24288,-0.23254 -0.52193,-0.33072 -0.27905,-0.10336 -0.60461,-0.10336 -0.74414,0 -1.17822,0.46509 -0.42891,0.46509 -0.42891,1.30741 0,0.49092 0.13952,0.80098 0.13953,0.31006 0.47026,0.5426 0.23254,0.1602 0.51159,0.21704 0.27905,0.0517 0.62012,0.0517 0.40307,0 0.81648,-0.10852 0.41341,-0.10852 0.77515,-0.31522 0.005,-0.10852 0.0103,-0.21188 0.0103,-0.10852 0.0103,-0.27388 z"
id="path5233" />
<text
xml:space="preserve"
style="font-style:normal;font-weight:normal;font-size:10.5833px;line-height:1.25;font-family:sans-serif;letter-spacing:0px;word-spacing:0px;fill:#000000;fill-opacity:1;stroke:none;stroke-width:0.0700042"
x="329.71533"
y="123.22275"
id="text5264"><tspan
sodipodi:role="line"
id="tspan5262"
style="stroke-width:0.0700042"
x="329.71533"
y="123.22275">10</tspan></text>
</g>
</g>
</g>
</svg>')
as varbinary(max))
end
go
 +6
+6- Thinkwise blogger
- 174 replies
- January 29, 2025
While I like
I think there would definately be value in adding some additional controls in order to enhance visualise data-ranges:
Gauges, thermometers, traffic-lights, sad/happy smiley faces, etc.
+6- Thinkwise blogger
- 174 replies
- January 31, 2025
Reply
Latest answered questions
The maps component, when drawing a route on it, puts a dot on Null Island
1 ReplyExpand cube fields in Universal vs Windows for an editable cube
1 ReplyShould Filter - Multiple levels listen to extended property "DisableFilterOnDetails" with backwards compatibility?
1 ReplyHow can I display a dropdown list for a field that's defined as an expression
14 RepliesModify process step
6 Replies
Enter your E-mail address. We'll send you an e-mail with instructions to reset your password.
Scanning file for viruses.
Sorry, we're still checking this file's contents to make sure it's safe to download. Please try again in a few minutes.
OKThis file cannot be downloaded
Sorry, our virus scanner detected that this file isn't safe to download.
OKCookie policy
We use cookies to enhance and personalize your experience. If you accept you agree to our full cookie policy. Learn more about our cookies.
×
Cookie settings
We use 3 different kinds of cookies. You can choose which cookies you want to accept. We need basic cookies to make this site work, therefore these are the minimum you can select. Learn more about our cookies.