Hello everyone, we want to have some kind of graphic presentation of data (dates) in a way that dates are on the X-axis and the values on the Y-axis. Is there any specific screentype or we need to create a cube with a type for it? Any suggestions?
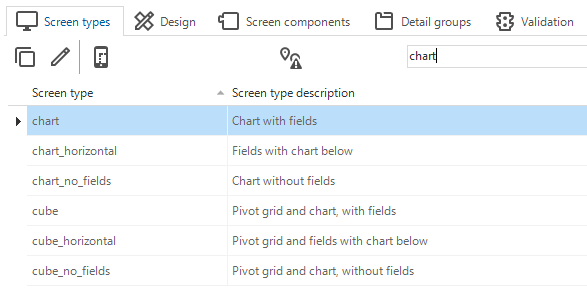
To show a cube in a screen, the screen type needs the Chart screen type component. The Software Factory provides a Chart screen type by default. You only need to assign it to the table/view that contains the data that needs to be presented.
Chart screen types
Assign the screen type using the tasks on the right side of the Screen type screen:
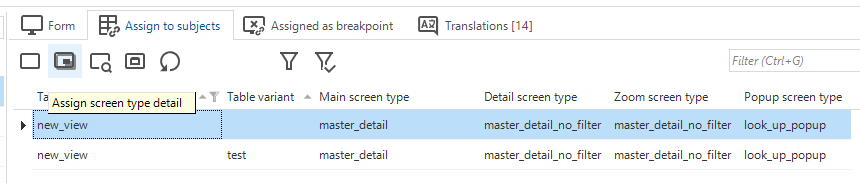
Assign screen type as Master and/or Detail screen type
To show a cube in a screen, the screen type needs the Chart screen type component. The Software Factory provides a Chart screen type by default. You only need to assign it to the table/view that contains the data that needs to be presented.
Chart screen types
Assign the screen type using the tasks on the right side of the Screen type screen:
Assign screen type as Master and/or Detail screen type
We use 3 different kinds of cookies. You can choose which cookies you want to accept. We need basic cookies to make this site work, therefore these are the minimum you can select. Learn more about our cookies.