For one of our customers we are trying to populate a tree view with 29800 nodes.  It feels sluggish. The base query takes 1 second.  How can we investigate further where delays are coming from?

@Freddy That's a lot of rows you retrieve in a single call! If you can't (or don't want to) limit the number of rows (Pagination), your options are limited. You might have checked these already, but I can think of the following things:

  • First of all, we don't do a separate data call for the tree view, meaning we retrieve all columns to which the user has access on the Subject. This could cause the call Size to be unnecessarily large and as a result negatively impact the Timing (check Developer Tools > Network tab to check the Size of the call. Then select the Call and check the Timing tab to review what causes the delay. Perhaps the Content Download duration is the bottleneck).
  • If retrieving all rows is not necessary for other Screen Components and the call Size is indeed the major cause, you could consider creating a dedicated View for the tree.
  • If the Size and Time of the Network call are not as high as the experienced ‘sluggishness’, please use a timer to see how long it takes from opening the relevant tab to building up the tree in it's entirety in the GUI. It might be that the Universal GUI needs a lot of time to build up the screen (this is not reflected in the Network and Timing tabs). If you're not on the latest Universal GUI (2024.3.10), please do try and test with that one too, as we tried to eliminate as many unnecessary Renders as possible.

Please let me know the results!


If you have large amount of items in the tree,  it will fetch the first X amount, based on pagination an it doesn't fetch the rest. So you either fetch everything or a part, and of course fetching only a part doestnt make much sense. 

if the pagination would be per level, this would make more sense. So everyone you open the tree he would look for the next X items. 
 

If reduced the amount of items to 6200, and opening the tree takes about 6-8 seconds.

Every item you click after that takes basically the same amount of time to load the details.


@Freddy That's a lot of rows you retrieve in a single call! If you can't (or don't want to) limit the number of rows (Pagination), your options are limited. You might have checked these already, but I can think of the following things:

  • First of all, we don't do a separate data call for the tree view, meaning we retrieve all columns to which the user has access on the Subject. This could cause the call Size to be unnecessarily large and as a result negatively impact the Timing (check Developer Tools > Network tab to check the Size of the call. Then select the Call and check the Timing tab to review what causes the delay. Perhaps the Content Download duration is the bottleneck).
  • If retrieving all rows is not necessary for other Screen Components and the call Size is indeed the major cause, you could consider creating a dedicated View for the tree.
  • If the Size and Time of the Network call are not as high as the experienced ‘sluggishness’, please use a timer to see how long it takes from opening the relevant tab to building up the tree in it's entirety in the GUI. It might be that the Universal GUI needs a lot of time to build up the screen (this is not reflected in the Network and Timing tabs). If you're not on the latest Universal GUI (2024.3.10), please do try and test with that one too, as we tried to eliminate as many unnecessary Renders as possible.

Please let me know the results!


I know limiting call results is the first answer, but let's say it's not possible nor wanted. 

I'm just trying to understand the buttons we can turn to have optimal performance. So I have already boosted the available memory on Indicium and the DB to rule out this as a prime factor. 

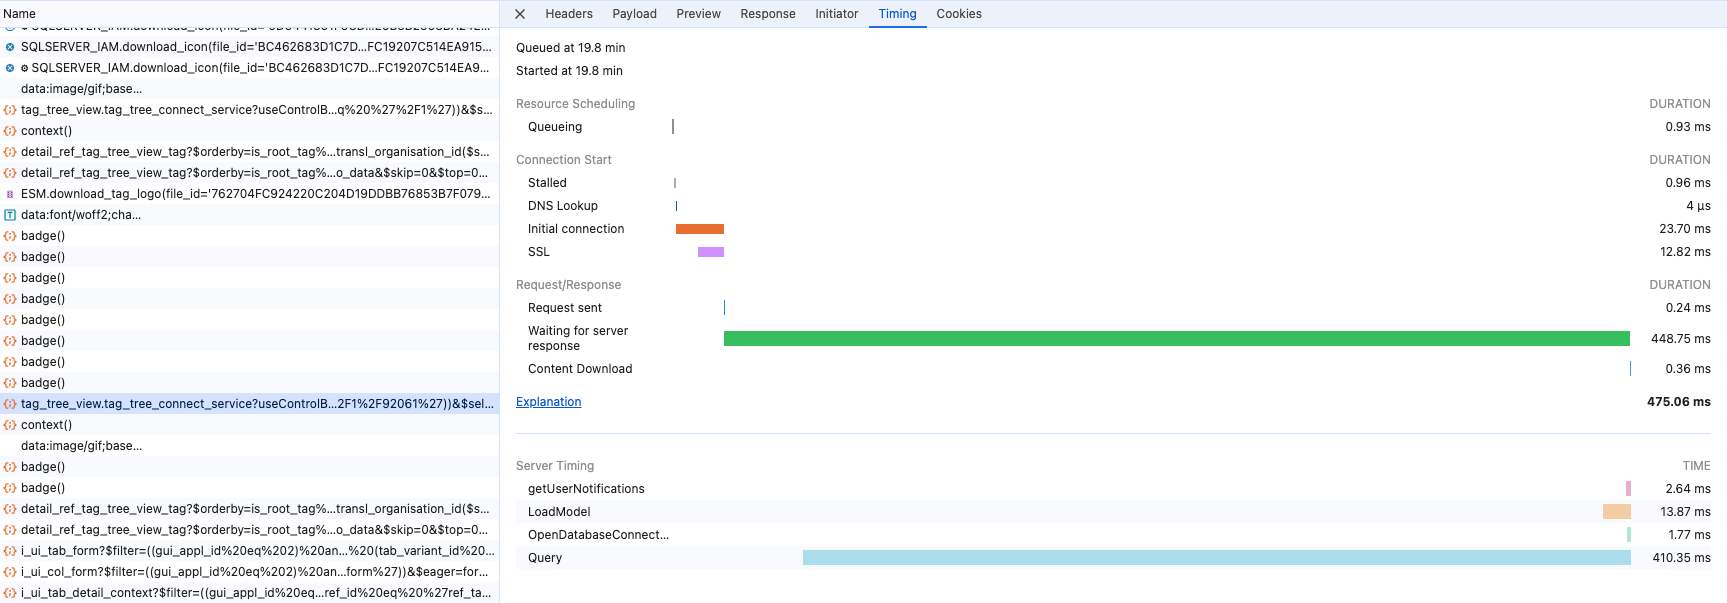
  • So the first call that gets the tree takes 400ms  and server timings say that 370ms is the query, which makes sense.. it's quite some rows. 
  • Then a context() is fired. Timing says 400ms waiting on server response.
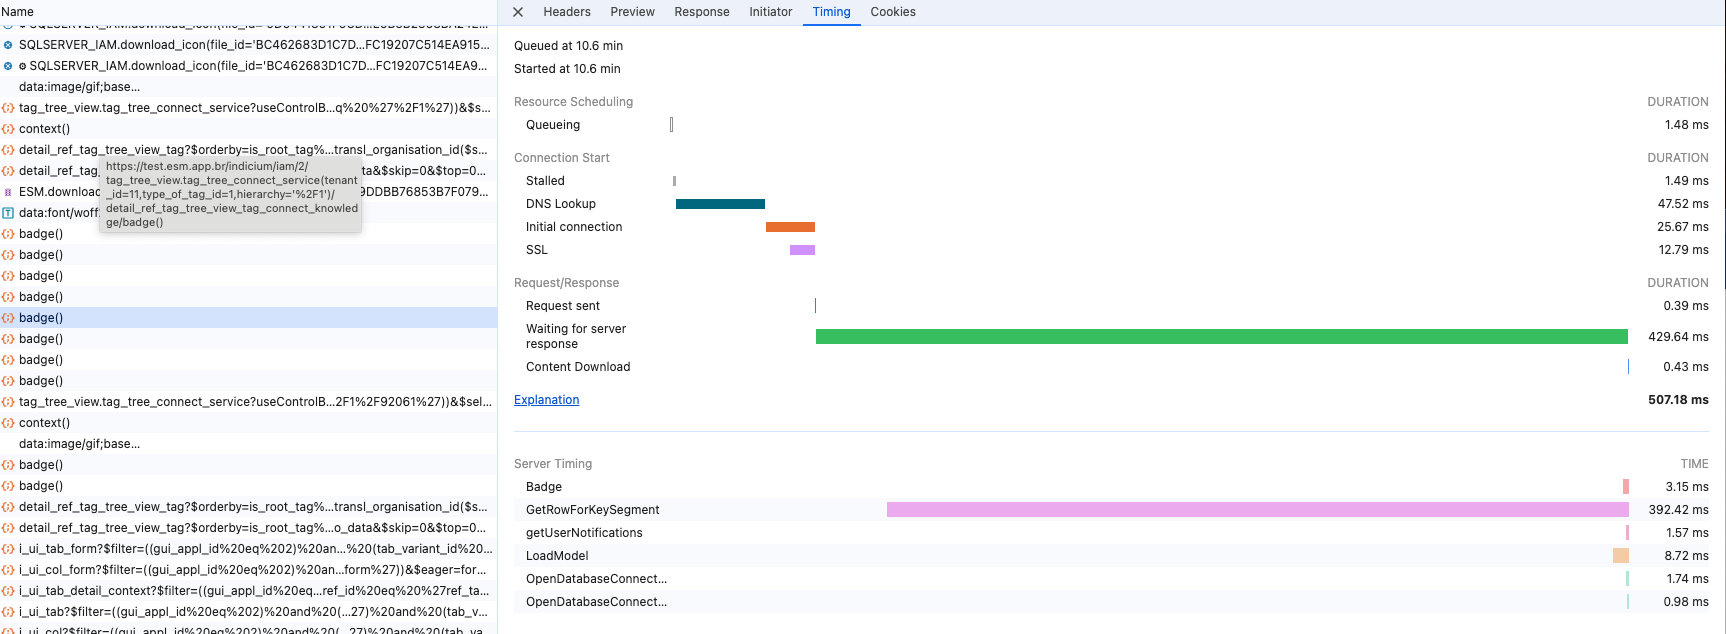
    • Timing: 390ms GetRowForKeySegment (what does this mean?)
  • Next 2 detail calls (1 for detail + 1 count)
    • Timing: 500ms each with server timing 437ms GetRowForKeySegment and 100ms OpenDatabaseConnection (first.. second db-conn 0.8ms)
    • Timings are similar between the 2 calls
  • Next a call to get the root node image for the tree:
    • 730ms waiting for server; 380 to get file record and 325 to get file stream. 

There is some increased limited stalling up to 1.5 ms .. 

However, the 'sluggish' thing happens when I then click on a random parent node (tree opens 1 level open). When in the GUI I click on the 5th node..  nothing happens. I'm assuming this refers to the initial connection/ssl  connection start timings, which are not present at the first call. 


Intermediate badge() calls take about 400ms .. also with GetRowforKeySegment 460ms…  what is this and why is it persistently high after the first call? 


if the pagination would be per level, this would make more sense. So everyone you open the tree he would look for the next X items. 

@tiago Pagination and Grouping are no good friends in the Universal GUI indeed. The combined behavior is not intuitive and not really workable. We have this on our radar (it’s an existing TCP ticket) and we are indeed considering a fix along the lines you describe. But properly fixing this is quite a challenge and not the highest of priorities at the moment.


@Freddy I am actually thinking along with you, so you don’t need to reduce the nr of rows. My suggestions are about optimizing the call in terms of columns retrieval, to limit that to what’s necessary for the tree only.

  • Timing: 390ms GetRowForKeySegment (what does this mean?)

@Freddy this is the query based on the Primary Key to retrieve information about the selected record. We see these kind of response times more often with Views, which is too high. Make sure to check your PK and Indexes setup in order to improve this Query performance. This explains all ~400ms calls for Badge / Context / Details as they all run over the Primary Keys.

I have been playing around with a large Tree and was actually positively surprised about how well it performs in the GUI.

I don’t really understand your explanation of ‘sluggish’ experience. With the information at hand, there is not much more we can help you with. 

If you truly think there is something the GUI could do better, feel free to raise a TCP and include a clear screen recording of your experience, together with a HAR for that recording.

Also, I’m still curious what Use Case you’re serving that requires so many records to be loaded at once and if there’s really no alternative to it.

How about starting empty with filter for example, or opening a Task from the menu that helps the user make a selection based on which you can do a filtered Open Document with the Tree?


@Arie V the business case is Brazil. In this case a bank that operates national, just to have some notion there are 5568 municipalities, including subdivisions there are over 10,670 districts.  If there is a branch per district and only 3 organization entities per branch then you are already over 30000 nodes. This case I didn't een consider matrix organizations et cetera. 

Don't get me wrong that we should always strive to minimize data sets and such.. but in a country with 212.6 million people and over 15 million businesses..  28.900 is not even that much. 

That said, I think @tiago said it correctly, we shouldn't want to load the tree upfront, but rather per level. Because the 'tree' doesn't get smaller..  But it is a waste of data to load the full tree, whilst this appear to happen again whenever you open up an extra level. 

As for the data, we already load the minimal amount. Just the root, parent, child, name and an icon (which is still empty for all)


Reply