Can anyone explain how we can configure a maps overlay?
The documentation does not provide enough details. Can a working example be attached?
https://docs.thinkwisesoftware.com/docs/sf/maps2#overlay-settings

 +21
+21Can anyone explain how we can configure a maps overlay?
The documentation does not provide enough details. Can a working example be attached?
https://docs.thinkwisesoftware.com/docs/sf/maps2#overlay-settings
Best answer by J. de Lange
For future reference: If you want an overlay that looks like the ‘Truck-free zone’ in the docks, you can use data mappings instead of an overlay and create a polygon data mapping and feed it with waypoints through a view or table:
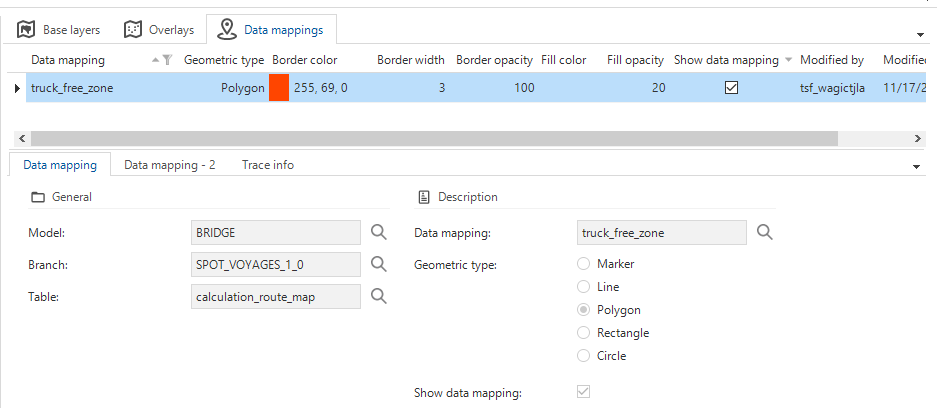
Make sure that the map component uses a view or table that contains columns with coordinates in JSON for example:
{
    "CoordSets": [
        [
            {
                "Lon": "6.932740",
                "Lat": "53.329700"
            },
            {
                "Lon": "6.932740",
                "Lat": "51.329700"
            },
            {
                "Lon": "8.932740",
                "Lat": "51.329700"
            },
            {
                "Lon": "8.932740",
                "Lat": "53.329700"
            },
        ]
    ]
}
and each row should contain a definition of the type of entity you want to display on the maps. You can make a domain with elements for this and select the element you would like to display on each row.
The two columns (coordinate and entity) should match the columns configured on your map component in the SF:

Enter your E-mail address. We'll send you an e-mail with instructions to reset your password.