Solved

Is there a way to change the used scale in the chart?

  • 5 January 2023
  • 2 replies
  • 47 views

Userlevel 4
Badge +14

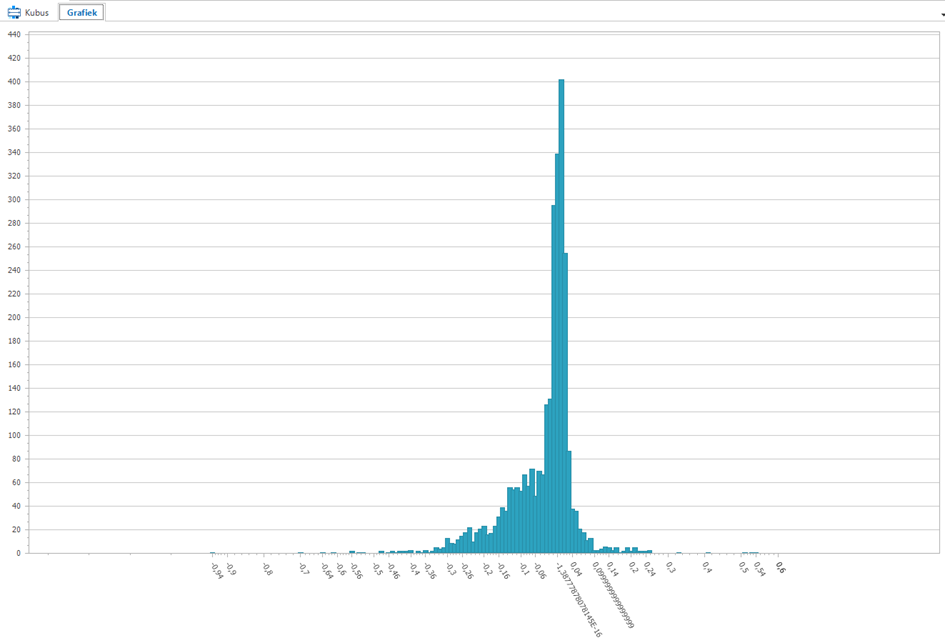
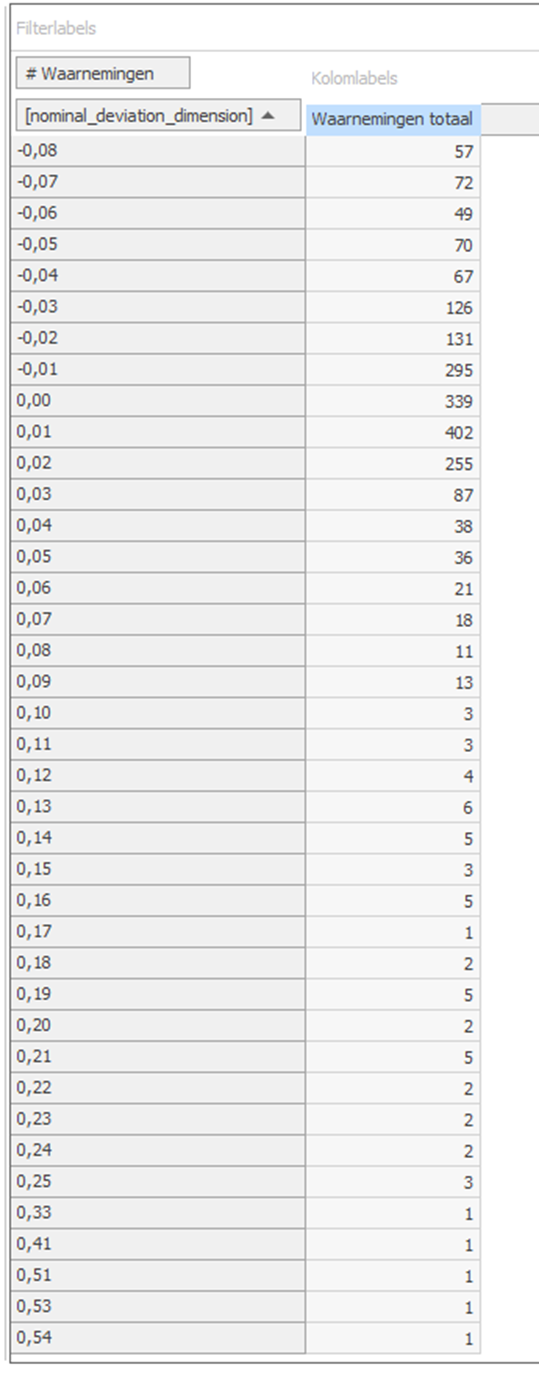
I have a cube view that shows numeric values as a dimension (2 dec) with the number of occurences as value. In the pivot table the values are shown as 2 decimals. In the chart it shows more decimals, even when the number of decimals is determined in SQL (cast .. as numeric(11, 2)).  

Is there a way to change this behaviour? 

Is it possible to reduce the initial scale? 


icon

Best answer by Edo Spijker 24 January 2023, 10:05

View original

This topic has been closed for comments

2 replies

Userlevel 2
Badge +1

Hello André, 

I’ve asked this question to our cube specialist and the awnser in would be no.
There is no way to change the used scale.

With kind regards,
Edo Spijker

Userlevel 4
Badge +14

Unfortunately. I can use an alphanumeric value for the dimension, but this only shows the measured deviations, not to scale.