


Hello everyone,
In this sprint, we added various performance metrics for requests using Server-Timing response headers. We also added the Agent ID to the Indicium landing page, and Indicium now automatically retries when encountering a database connection failure on startup.
You can read more about Indicium's features in the Indicium user manual.
We will keep you updated regularly about Indicium's progress.
Contents of this release
Breaking Changes
Thinkwise Platform support release 2020.1 ends
Indicium support for Thinkwise Platform release 2020.1 is ending. Please upgrade to at least release 2020.2 to use this release of Indicium.
Indicium Universal
Measuring Server-Timing responses
In this release of Indicium Universal, we have added various performance metrics for requests using Server-Timing response headers. Browser developer tools can interpret these headers and visualize these performance metrics. The goal of these features is to give more detailed insight into performance and help solve potential performance issues, which are almost always caused by specific queries, layout procedures, file storage operations, etc. that can be optimized fairly easily. We have already added dozens of these performance metrics, which are listed below, and we are looking into adding more of them in the future.
CRUD operations
- All SELECT queries for requested subjects of an application (tables and views).
- When the $count operation requests the total number of records, this will be measured and returned separately.
- When the $expand operation joins a lookup or a detail subject, these will each be measured and returned separately.
- Insert statements.
- Update statements.
- Delete statements.
- Expression queries while adding or editing a record.
- Default value queries when entering edit mode to add a new record or start a task or report.
- Lookup validations when changing a lookup value or a lookup filter value.
Application logic
- Tasks
- Subroutines
- Default procedures.
- Layout procedures.
- Context procedures.
- Badge procedures.
- Change detection procedures (the new logic concept).
File storage
- Fetching the database record for a file to be downloaded.
- Calculating the hash of a file.
- File access (this can be considered as obtaining a file connection, but does not include the entire download process).
- Writing files (this does include the entire upload process).
Miscellaneous
- Fetching records by primary key. This is, for instance, done when starting a task in the context of a record. This record will first need to be fetched.
- Loading the application model. After restarting Indicium or changing the application model, the model needs to be loaded, which may take multiple seconds on top of the request performed.
Once you have installed this version of Indicium Universal, you can see these metrics under Server timings in your browser's developer tools.
Some examples (partially in Dutch) are shown below.
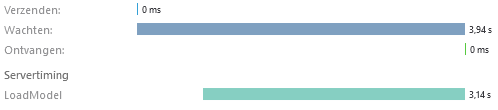
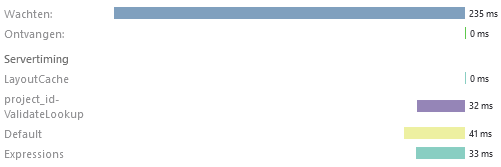
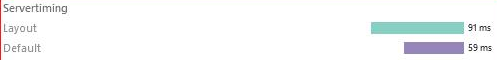
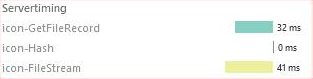
Examples of Servertiming metrics
Retry start-up on connection failure
When Indicium encountered a database connection failure during start-up, it would not automatically retry. As of this version of Indicium, a retry occurs every two minutes for up to 10 minutes. The cause of the connection failure could be a temporary issue with the database server or network that resolves itself.
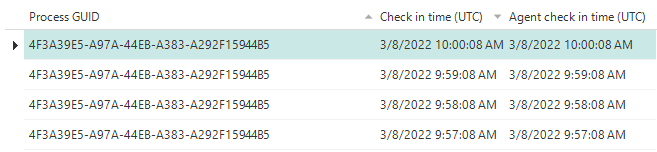
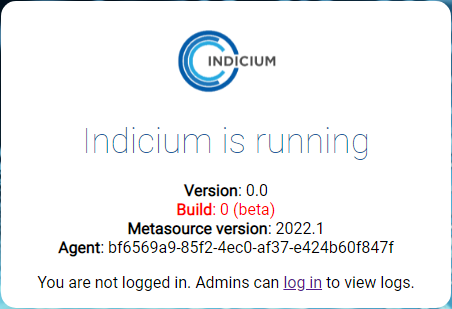
Agent ID on the Indicium landing page
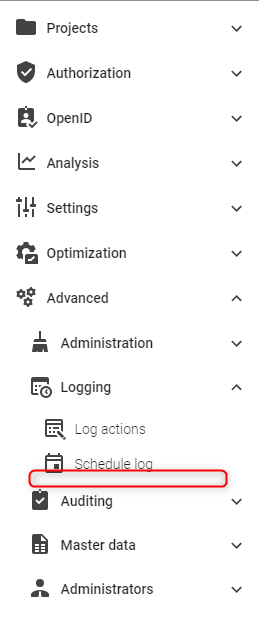
Indicium's landing page will now show the Agent ID of the Indicium instance. This Agent ID corresponds to the IDs that you will find on the 'Agent check in' screen in IAM's advanced menu. It can help you troubleshoot issues regarding system flows. You can also use the Agent ID to test if your load balancer's sticky sessions configuration is working by refreshing the landing page a few times and checking whether the Agent ID stays the same.
Language of translated messages by application connector
If a tsf_send_message procedure sends a message to the application connector, the message is now translated into the language of the user who initiated the process flow.
If the application connector is called from a system flow, then the message is translated into the application fallback language.
Messages filtered out in log files
The following messages are now filtered out in the log files because they often occur and can quickly fill the log files, making them difficult to search for errors:
- schedule_not_found
- system_flow_already_running
- system_flow_still_running
Minor fixes and tasks
-
In the database event log, SQL queries and messages did not contain newline characters, which made the statements poorly readable and could cause problems with single-line comments. This has been fixed.
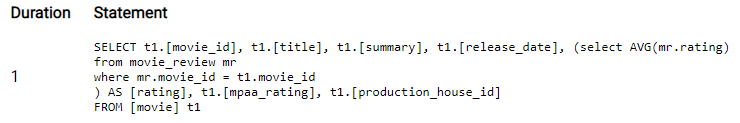
Example of a SQL query with newlines