


At Thinkwise, we strive to make development and maintenance of enterprise applications as easy as possible. But in the end, an operational application will have a lot of moving parts. Performance troubleshooting comes down to identifying and resolving a problem in one of those many moving parts.
Unfortunately, most of the time it ends up in a witch hunt. Kick in every virtual door to find out what causes the curse. This makes performance troubleshooting very time- and resource intensive. Today, I’ll share a very focused approach to resolve performance issues.
The title of this blog might as well be: How to avoid the red herrings!
Performance troubleshooting process
There are many ways to approach performance troubleshooting. This blog uses a certain script that can be used and adapted for your own needs. The script assumes a single, agile development team working on an application.
I’ll go into detail for all the steps, but I’d like to start off with a TL;DR.
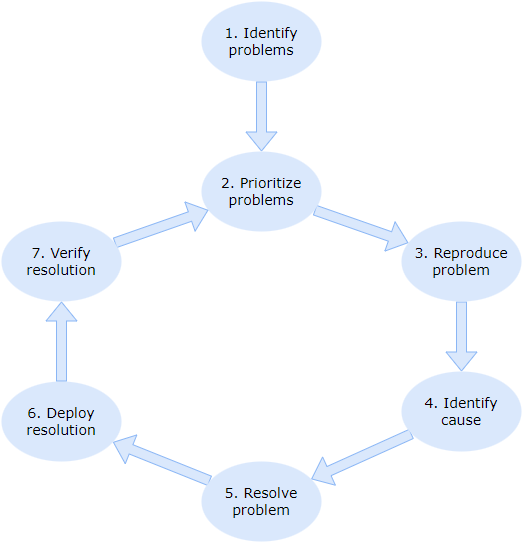
- Identify problems. Ensure you have all the relevant information and know the user expectations.
- Prioritize problems. Don’t bundle problems, pick the most detrimental and specific one.
- Reproduce problems. Keep production and test in sync. Failure to reproduce points to a cause.
- Identify cause. Trace from UI to backend. Use the available tooling to prove your claims.
- Resolve problems. Try to find a single resolution as to not muddy the waters. Quantify resolutions.
- Deploy resolution. Hotfix or with a planned release. Allow for rollback, try not to bundle resolutions for multiple performance problems.
- Verify resolution. Involve the end users. Consider re-validating other performance problems. Update what constitutes relevant information.
The blog closes with various ways to solve things ahead of the problems occurring when it comes to performance.
Now to go into detail.
Step 1: Identify problems
This step is the key step in this approach. We need to collect all relevant information to be able to reproduce the problem.
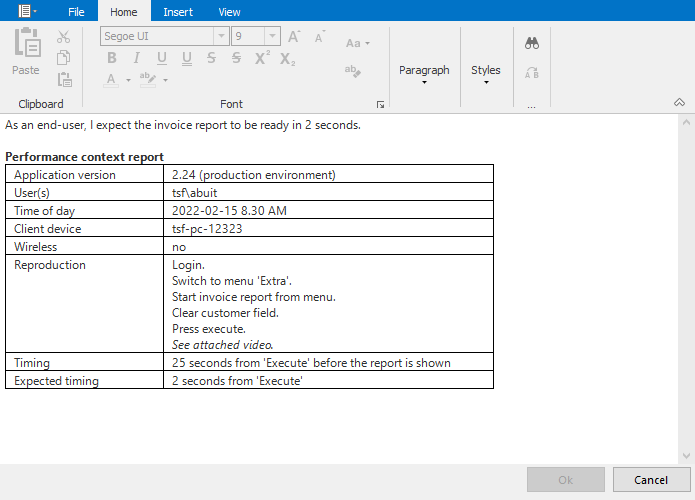
All moving parts should be described as accurately as possible. We’ll call this the context of the performance problem. The context may vary per business and application, but I’d suggest you document at least the following items:
- Application version
- User id(s)
- Time of day
- Client device information
- Client connectivity information
There are a lot more items you can record, specific to your application. As you resolve performance problems and identify causes that could have been recorded context, you can add them for the future as well.
Furthermore, ensure the following items are recorded:
Reproduction: All the steps taken from a fresh login. It can be quite frustrating to find out that the user was experiencing problems on a self-named screen that happened to match an existing location in the application. A screen recording or HAR file is always great but note data sensitivity.
Timing: How much time did a certain step take? This is something that is important to verify later when reproducing the scenario. If the problem is already resolved, it may waste a lot of time.
Expected timing: How much time does the end-user expect the action to take? Some resource intensive actions are simply time-consuming. At this point, it is more of an expectation management problem rather than a performance problem.
Ensure this information is recorded in a proper manner. For instance, you can store this information in some tabular form or create a template for a performance-troubleshooting user story in your work-management tooling of choice.
When using a scrum-based approach, the Product Owner would be responsible for describing this as a user story with all necessary information attached.
Step 2: Prioritize problems
It would be great if a single performance problem pops up. But the nature of performance problems usually results in a lot of widely varying reports.
While it is tempting to try and solve all problems at once or to approach them as a single problem, this can cause certain issues:
- Delayed rollout of the bundled resolutions.
- Partial resolution, causing the stakeholders that did not see improvement to lose trust in the ability of the team to resolve the problems.
- Conflicts, where the resolution of one problem is nullifying the other resolution.
- Lack of focus in cause detection, causing red herrings.
Instead, we’ll simply order all the performance problems and work on one performance problem at a time. The prioritization should take actual business impact into account. More importantly, there is a case to be made to always prioritize specific application performance problems over generic performance problems.
Resolutions for specific performance problems often resolve generic performance problems. Generic performance problems are often hard to reproduce and hard to pinpoint.
A slow query being optimized may resolve the performance of a certain task or report, but may also reduce the number of locks and wait times on the database and CPU/IO being taken up by that query. And in turn, resolve other, more vague performance problems that seem unrelated.
The Product Owner is responsible for prioritizing these performance-related user stories.
Step 3: Reproducing the problem
Before the causes of the problem will be identified, it is imperative to verify that the problem is still relevant and can be safely investigated without disrupting the production environment. Using the provided context and reproduction information, the performance problem should be reproduceable by the development team in a test environment.
Having a good, representable test environment is paramount. If the problem cannot be reproduced in the test environment but persists in production, the differences in load, data or infrastructure may point towards the cause.
It is still advisable not to jump to this conclusion and instead try to update the test environment to match production, to be able to reproduce the problem. Simulating transactional load on the test environment might be necessary. There are various tools available to record and simulate load.
The data sensitivity module in the Software Factory can be used to configure targeted anonymization to allow a back-up containing anonymized, production-like data to be used in a test environment.
If the problem cannot be reproduced in test or production, it might be worth lowering the priority until it reappears. At this point, re-assess what should be included in the context. For instance, the performance problem might only occur when using the application in a certain physical location, such as a meeting room. The test environment should be adjusted to match the new context information.
Last but not least, changes to the application, platform or infrastructure over time might have rendered the problem obsolete. A final check should be done with the user reporting the performance problem.
Step 4: Identifying causes
Now that we have a proper description and reproduction of the problem and we know that we are working on the most important performance problem, we can start looking for the cause.
The broader the performance problem, the more likely it is that the infrastructure plays a key role in the cause of the performance problem.
For more specific problems, changing individual items in the context is a good way to further pinpoint the cause.
For instance, can the performance problem be reproduced with every user with the same roles or just this single user?
Since performance problems are identified as seen from the user, the easiest point to start off is as seen from the user.
The process of identifying causes is highly specialized work by the development team. There are some key tools and indicators that may help identify causes, but we could write an entire blog about this. For now, I’ll keep them concise.
Front-end tools
Web applications can use the browser traffic monitoring that is offered by all browsers. Simply press F12 and navigate to the Network section.
The Windows GUI offers a Debug window in the developer ribbon tab to identify the duration of webservice or database requests.
All Thinkwise user interfaces start by loading the application model. This is done by interacting with the Intelligent Application Manager database. When the problem is related to start-up, verify the performance of the calls to iam/iam/i_ui_ endpoints or get_gui_ webservice calls or procedure calls. Note that caching may prevent the issue from reoccurring.
Interaction with the application can be seen in fine-grained calls to the backend. This will help in identifying performance problems. A slow call can usually be directly traced back to a certain CRUD action, certain logic, a task or report execution or a process flow. Errors should be investigated - more info here.
Note that the interaction with the database by the service tier may not be directly visible from the UI. Indicium offers a database event log to further investigate this. When the user is configured for developer mode in IAM, the user can access the database event log via the Universal profile menu or by directly going to indicium/account/ui/dbEventLog.
A single call to Indicium may result in multiple database calls. For instance, a PATCH may cause verification of look-ups and execution of business rules.
Webserver tools
Major differences between database event log timing and actual request timing are often an indication of one of the following:
- Delay due to data transfer between server and client (bad connection or much data).
- Delay due to file access (if the request is file-related).
- CPU bottleneck on the web server to serialize and compress the data.
Note the response size when the problem seems to be related to data transfer. It may be hard to miss when some application images are several megabytes in size.
Perfmon and configuring Application Insights are great ways to get a better idea of your web application performance. Read more on how to set this up here.
Database tools
When the database query log (Indicium) or debug window (Windows) also indicate slow query response times, the database must be investigated.
For instance, the following query from the Indicium query log should be executed as following on the database to get a good idea of the timing.
Indicium log:
declare @handle int;
exec sp_prepexec @handle output, N'@p0 bigint, @p1 varchar(128)', N'SELECT t1.[gui_appl_id], t1.[tab_id], t1.[conditional_layout_id], t1.[conditional_layout_condition_no], t1.[col_id], t1.[condition], t1.[type_of_value], t1.[value], t1.[value_col_id], t1.[until_type_of_value], t1.[until_value], t1.[until_value_col_id]
FROM [i_ui_conditional_layout_condition] t1
WHERE t1.[gui_appl_id] = @p0 AND t1.[tab_id] = @p1', @p0=818, @p1='email'
To further analyze queries, you can run the query with io statistics and time statistics, analyze the execution plans and use the Query Store. The database server health can also be monitored using Perfmon.
Note that time of day may play a significant role in database performance. One of the problems that may occur is out-of-date database statistics. To resolve this, statistics on the database are often updated automatically. If this is done at night, the statistics may be skewed as they do not represent the daily operations. For instance, the statistics may indicate there are no new orders, when all orders are processed during the day. This may cause problems when selecting just the new orders.
Once the cause has been found, we can start working towards a solution.
Step 5: Resolve problem
Resolving the problems is again highly specialized work. A query plan may have identified the need for some indexes, network traffic may be reduced by restructuring the screens or some technical limits are being reached and scaling is in order. Note that some resolutions may be outside the scope of the development team and may require support by IT Systems or Infrastructure Operations.
If a problem is caused by Indicium or a User Interface performing aberrant with a combination of certain model settings, contact Thinkwise Support. Chances are that a solution is known, or the problem can only be resolved via an updated version of the runtime component.
Some problems have a very straightforward solution. But there are plenty of problems that may be resolved in a variety of ways.
It may be tempting to apply more than one resolution. For instance, improving a query for a report and adding more CPU to the webservers. But this is not recommended. Unless both are required to resolve the performance problem, pick a single resolution for the problem. Ensure this resolves the problem in the reproduction scenario. If not, replace the resolution and if not quite yet, add resolutions.
The risk of applying multiple resolutions all at once is that one of them may not even have been the root cause. Improving the query seems to have helped in conjunction with the added CPU power, but if the CPU was the actual problem, the query may have been fine as it was, and the change may actually have made things worse. Yet this goes unnoticed as it piggybacks on the other performance improvement.
The reproduction scenario should be used to test whether the final resolution is sufficient. Quantify the resolution by re-running the reproduction and comparing the actual timing.
Step 6: Deploy resolution
The resolution can be rolled out as a separate increment (a hotfix) or with a planned increment to resolve the performance problem in production. How this is done really depends on the urgency and the deployment structures that are in place to make this process easier.
Resolutions in infrastructure or hosting may have to be rolled out by the IT Operations or Infrastructure team. This may be outside of the regular increment cadence.
Releasing a resolution that can also be rolled back is often desirable. When bundled with other changes, the problem might seem to have persisted while the resolution was actually correct, but a new problem was introduced by the other changes. While the problem is technically resolved and a new problem has been introduced, it is difficult to convey this to the end-users.
Step 7: Verify resolution
The user should be informed of the quantified improvement with the provided resolution. Ideally, the end user attempt to reproduce using the exact same context as the performance issue was identified.
If the problem wasn’t resolved, the assumptions made while identifying the causes were incorrect. Assuming the problem is still the most important problem, the changes can be rolled back and a new cycle to reproduce, identify and resolve begins - provided this is still the problem with the highest priority.
There is a risk that the end user will not accept the resolution. Therefore, expectations need to be managed on the ‘Expected timing’ mentioned at the problem identification. When a performance problem occurs with a planning algorithm, it would be good to agree on beforehand that the algorithm taking a minute or two is acceptable, as a few seconds might simply not be feasible.
If the cause could have been more easily identified if more context information was recorded when the problem occurred, ensure the template is updated to record this context information from now on.
E.g., when a performance problem is resolved that turned out to be related to the user language, due to some complex reporting, it might be worth recording the users’ application language as context from now on.
Next up is to reassess the priority of the remaining performance problems and continue if needed with the next item on the list.
Rinse and repeat
Once a resolution has been rolled out, it could be good to re-verify the priority all other pending performance problems with the end-users. The resolution may have resolved various other problems. Even when they seem unrelated as mentioned before.
This really depends on the time and effort that will need to be invested. The Product Owner may also choose to belay this and weed out resolved performance problems when attempting to reproduce, once they are next on the list to be resolved.
Preventing acute performance problems
Having a good script to troubleshoot performance challenges is one thing. Preventing these is always better than curing them. However, it does take continuous effort to set up, execute and monitor preventative measures.
A load test provides insight in how well the application performs under regular and peak load. A load test is paramount for a good release but can also be used periodically to find regression in performance and to find bottlenecks due to changes in the application, usage, or underlying infrastructure.
A stress test will push the entire application stack to the limits which will help to quickly identify bottlenecks. These can also be scheduled periodically.
Monitoring the application using appropriate tooling will allow the team to get ahead of performance problems and the fixed context of these tests will help speed up remediation before they occur for end users. As mentioned before, Application Insights is a great tool for this.
Performing performance-oriented maintenance on the various servers, components, and the application itself is important to keep the application fast in a dynamic environment. Some examples:
- Databases
- Data retention strategies for growing entities
- Monitoring suggested indexes
- Rebuilding fragmented indexes
- Updating statistics
- Updating database servers (if applicable)
- Webservers
- Periodical recycling
- Log retention plans
- Updating webservers (if applicable)
- Updating runtime components
- Monitoring bandwidth usage
- Clients
- Wireless coverage checks
Closing
There is no silver bullet to quickly pinpoint and resolve performance problems. The script provided in this blog relies on expertise and experience of the development team and IT teams to pinpoint and resolve the problem, while the Product Owner prevents wild goose chases and red herrings by structuring the administration, prioritization, and rollout of performance-related items on the backlog.
Leave a comment if you want to share your views on this subject. What piece of contextual information is paramount for your performance troubleshooting process? What are your tips-and-tricks for identifying causes? We’d love to hear about more real-world preventative measures for application performance as well.
And as always, if there are ways the Thinkwise Platform can make this process easier, feel free to create a topic in our ideation section.