
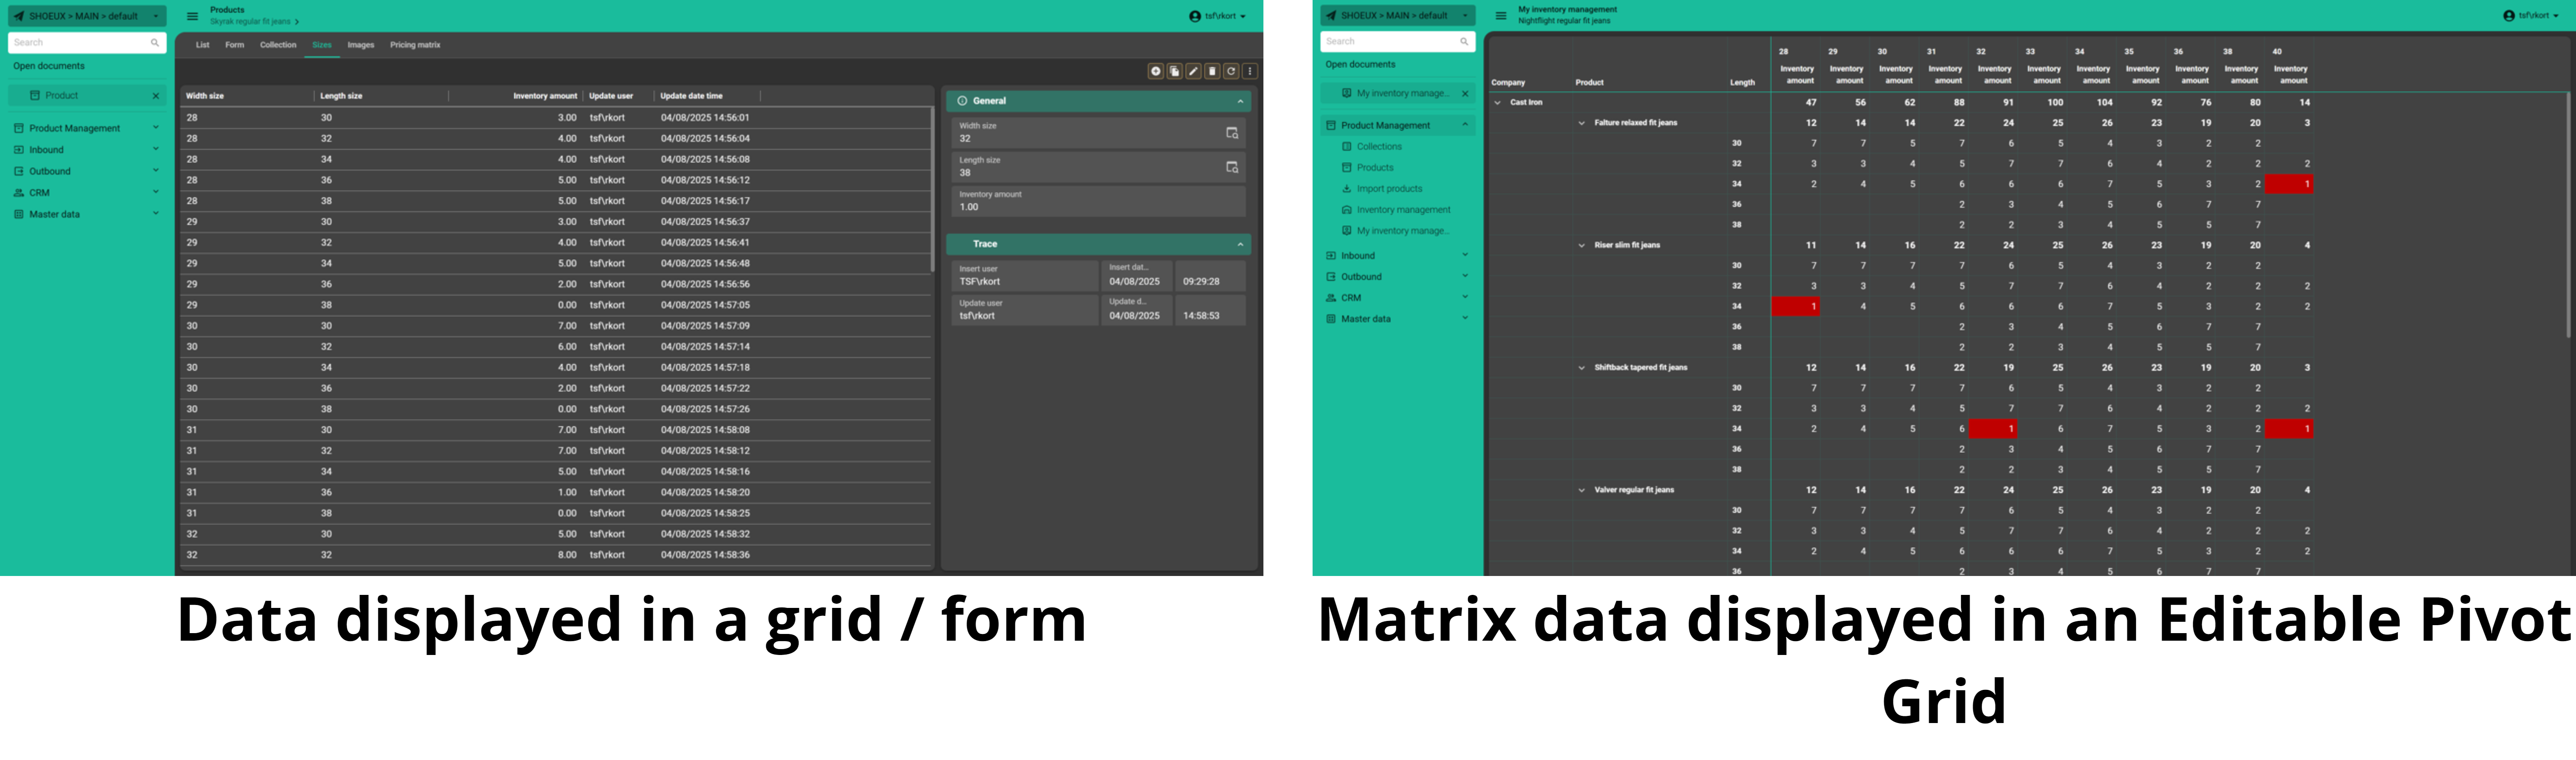
In an average Thinkwise application most data is displayed using a grid / form combination. For most data this makes sense, as you can search data in the grid and manage it in the form.
Some data becomes clearer and easier to work with when visualized as a matrix, arranged in a grid of rows and columns similar to a table or spreadsheet. Unlike the standard Grid screen component, however, the rows and columns in an Editable pivot grid can be defined dynamically through data, offering much greater flexibility.
The (previously well hidden) way to present matrix data in a Thinkwise application is using an Editable pivot grid.
The Editable pivot grid has the following key characteristics:
- Quickly manage large amounts of data
- Recognizable to users because of similarity to tools like Excel
- Row and column values are defined in data. This allows for much greater flexibility than regular forms where columns are predefined.
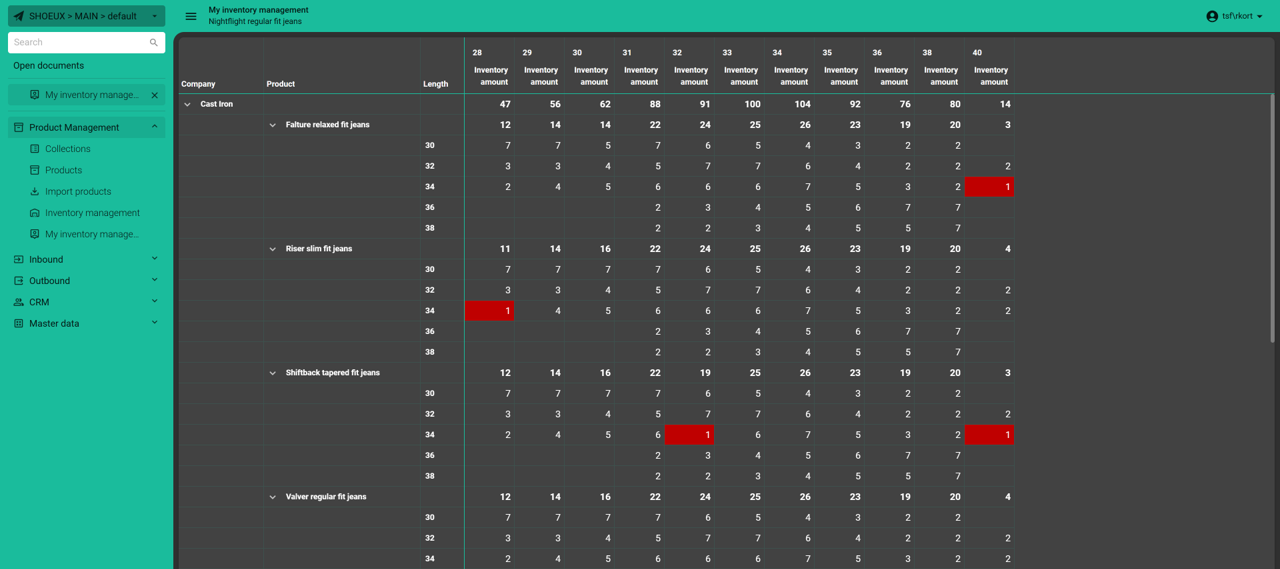
An example of how to use an Editable pivot grid to show matrix data is a product inventory screen for stores. Jeans for example, have many different variations, because they use width / length sizing. Showing this data in a grid would quickly get unwieldy, because the list would be really long. By using an Editable pivot grid we can display the brand, product and length as rows and the width as columns. This gives us a view of all of our products, with all of their variations, on a single screen.
Another use case is project capacity planning, where projects are displayed as rows and weeks as columns in the pivot grid. This layout makes it easy to manage how much capacity is allocated to each project on a weekly basis. Similarly, a department budgeting screen might show departments as rows and months as columns, allowing for quick and efficient entry and management of departmental budgets.
Step by step guide
In this blog we will build a pivot grid that allows you to easily have an overview of a stores’ inventory of jeans. Jeans are ordered using a width and length system as opposed to T-shirts which use a much simpler S/M/L sizing system. This means that there are a lot more different sizing variations that a store needs to manage.
In this Editable pivot grid we will display all the jeans the store sells. For each product we will then show all available length sizes as a row and all available width sizes as a column. The value shown in the grid is the current inventory amount. By changing this value the amount of inventory that the store has can be updated.
1. Data model
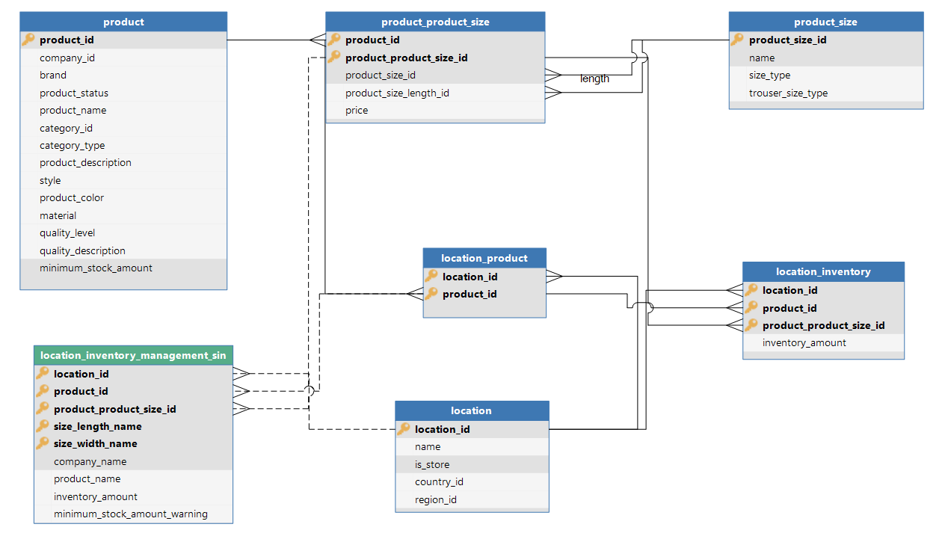
Our application has the following data model:
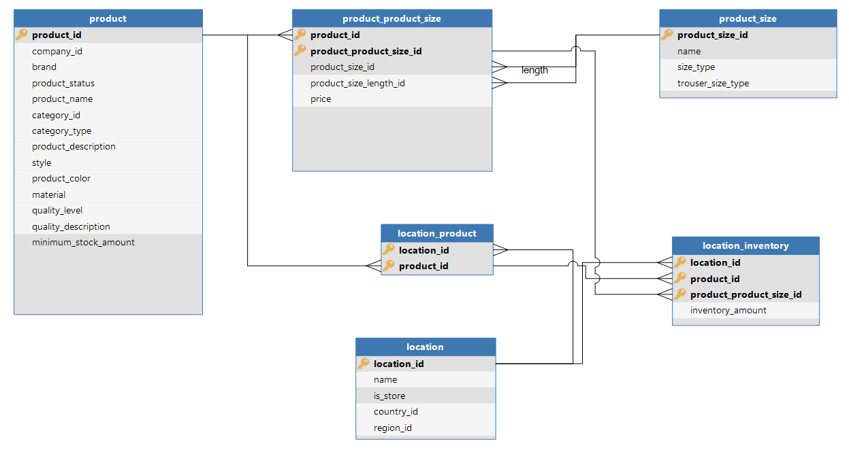
This data model allows us to have products in various sizes. These products can then be stored as inventory for a store.
To make an Editable pivot grid we start by creating a view. It is useful to create a separate view when building Cubes because it allows for flexibility in deciding which data is presented and how it is presented to the user. Using a view also makes it much easier to have grouping / tree structures.
The view is created using the following control procedure template:
select l.location_id
      ,lp.product_id
      ,li.product_product_size_id
      ,psl.name
      ,psw.name
      ,co.company_name
      ,p.product_name
      ,li.inventory_amount
      ,case when p.minimum_stock_amount > li.inventory_amount then 1 else 0 end
from location l
     join location_product lp
       on lp.location_id = l.location_id
     join location_inventory li
       on li.location_id = l.location_id
      and li.product_id = lp.product_id
     join product p
       on p.product_id = lp.product_id
     join company co
       on co.company_id = p.company_id
     join product_product_size pps
       on pps.product_product_size_id = li.product_product_size_id
     join product_size psw
       on psw.product_size_id = pps.product_size_id
     join product_size psl
       on psl.product_size_id = pps.product_size_length_id
where exists (
                 select 1
                 from employee e
                 where e.tsf_user = dbo.tsf_user()
                   and e.location_id = l.location_id
             )
This gives us our updated data model:
2. Handler
When a row is edited in an Editable pivot grid it will trigger an update of the row. The preferred way to update a view is by using a Handler.
In this example the Handler contains a simple update statement that will update the “location_inventory” table:
--update location inventory
update li
set li.inventory_amount = @inventory_amount
from location_inventory li
where li.location_id = @upd_location_id
and li.product_id = @upd_product_id
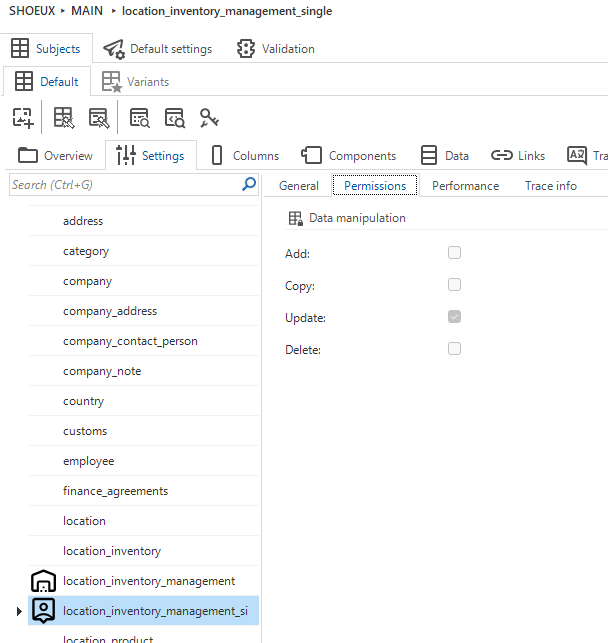
and li.product_product_size_id = @upd_product_product_size_idTip: Always check the subject settings of the view to make sure that updates are allowed.
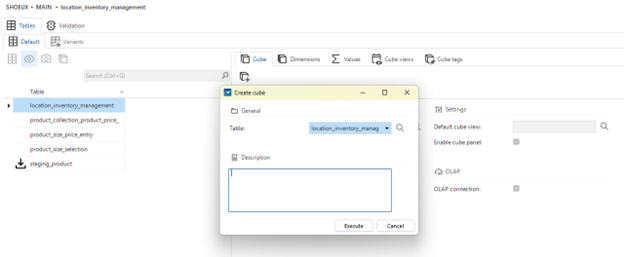
3. Cube setup
Cubes are created in the cube screen (User Interface -> Cubes). In this screen select the subject, in our case this is the “location_inventory_management_single” view we created. Use the task “Create cube” on the screen to start an Enrichment which will create a basic cube setup. This Enrichment will set the screen type of the subject and it will create dimensions/values based on the data model of your subject.
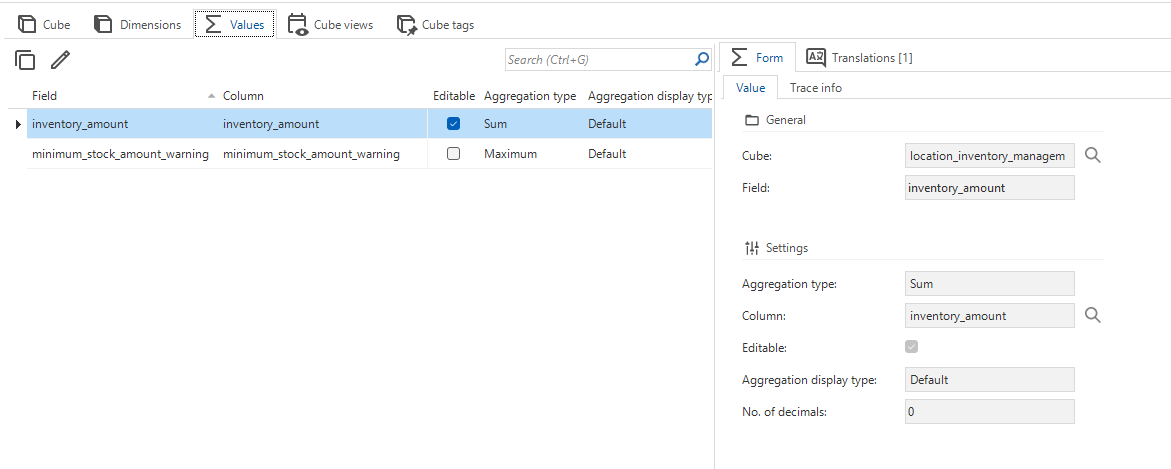
The next step is to make a value field editable. To do this we select the value we want to make editable and enable the editable checkbox. This field will now be editable if the following criteria are met:
- A value needs to be unique in the pivot grid (you can only update a single row at a time)
- The subject allows updates
- Cube field is set to editable
- The aggregation type must be set to min, max, sum, or average
4. Cube view
When using an Editable pivot grid you want to give users only predefined cube views. This is to prevent confused users, who otherwise inevitably will end up changing a cube view into one where data cannot be changed because one of the criteria mentioned above is not met.
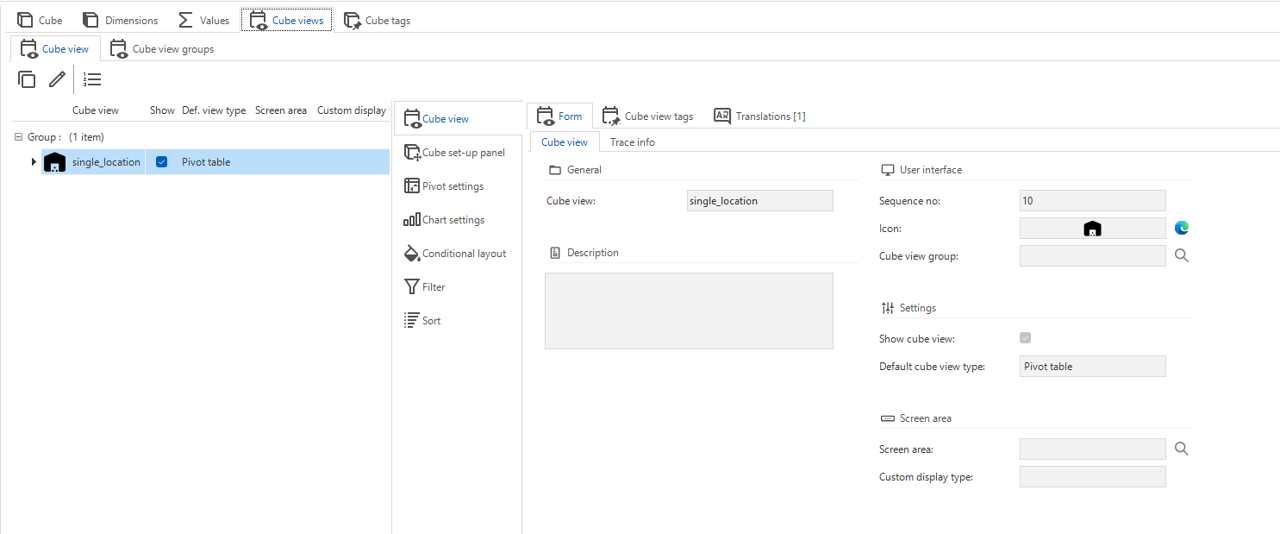
We start by creating a cube view:
In the Cube set-up panel we then define the rows, columns and data values:
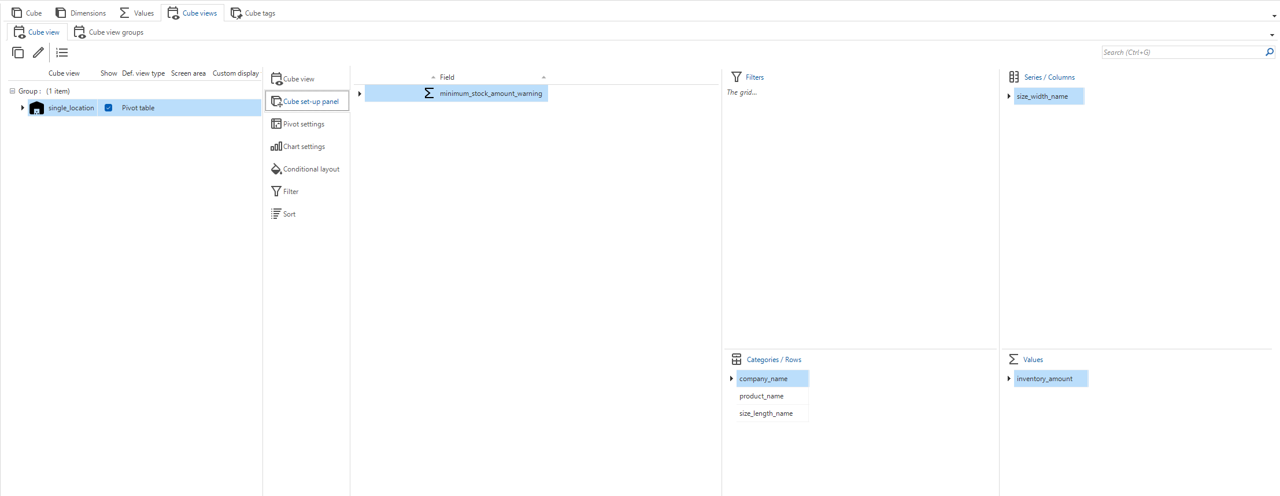
For more information about setting up a cube view, see our documentation
To further enhance the usability of a pivot grid you can use options such as field width, default expand, conditional layouts and sorting.
5. Screen configuration
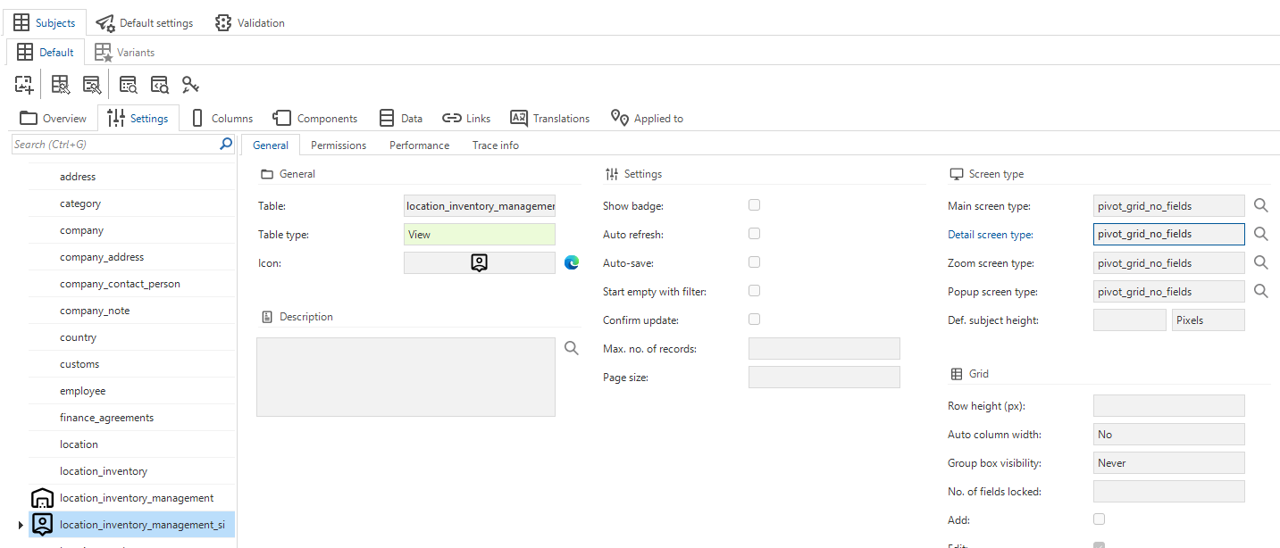
When a cube is created on the cube screen, the screen type of the subject will automatically be changed to “cube”. However, when building an Editable pivot grid, we do not want users to have the option to change cube dimensions or to display the cube as a graph. To prevent this, we need to change the screen type to “pivot_grid_no_fields”. This is a standard screen type that only contains a pivot grid.
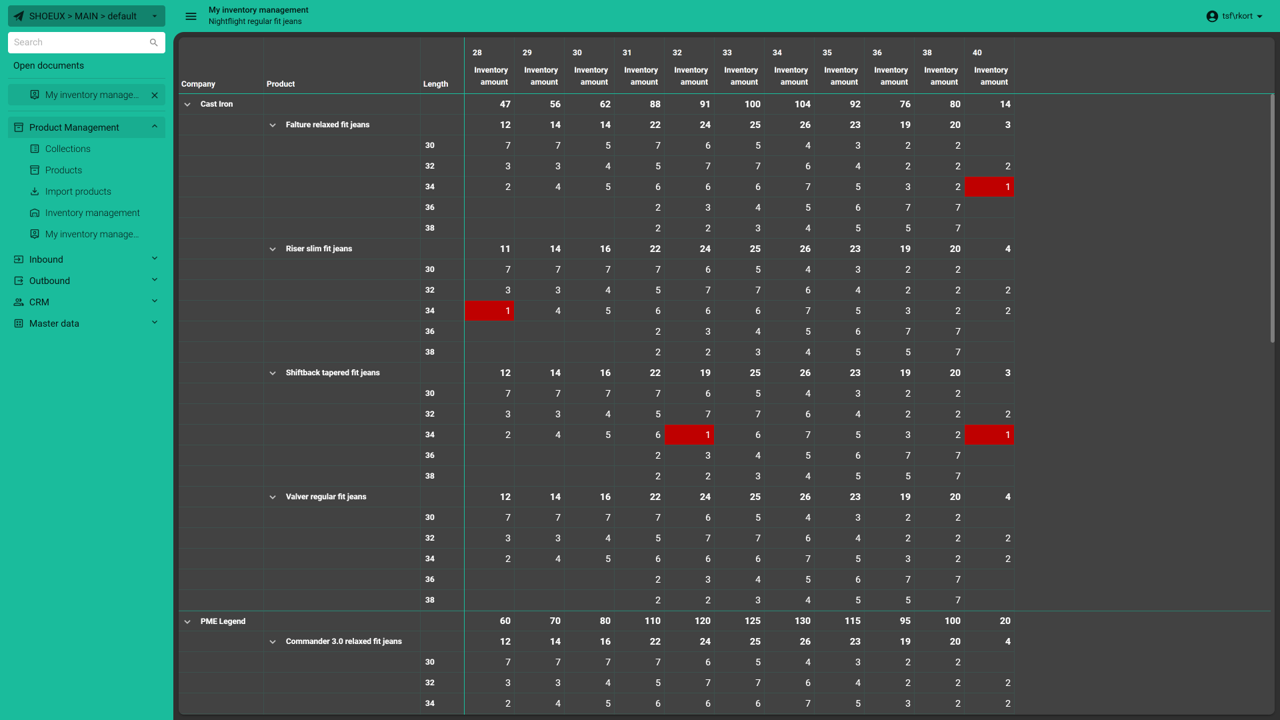
With everything set-up, this is our final result:

Conclusion
The Editable pivot grid is a game-changer for presenting matrix data — familiar to users and powerful enough to display large amounts of information in a single, clear overview. Unlike forms, it allows you to dynamically define rows and columns based on your data, offering unmatched flexibility. And now, with its full integration into the Thinkwise Platform in the 2025.1 release, it’s easier than ever to set up and use!