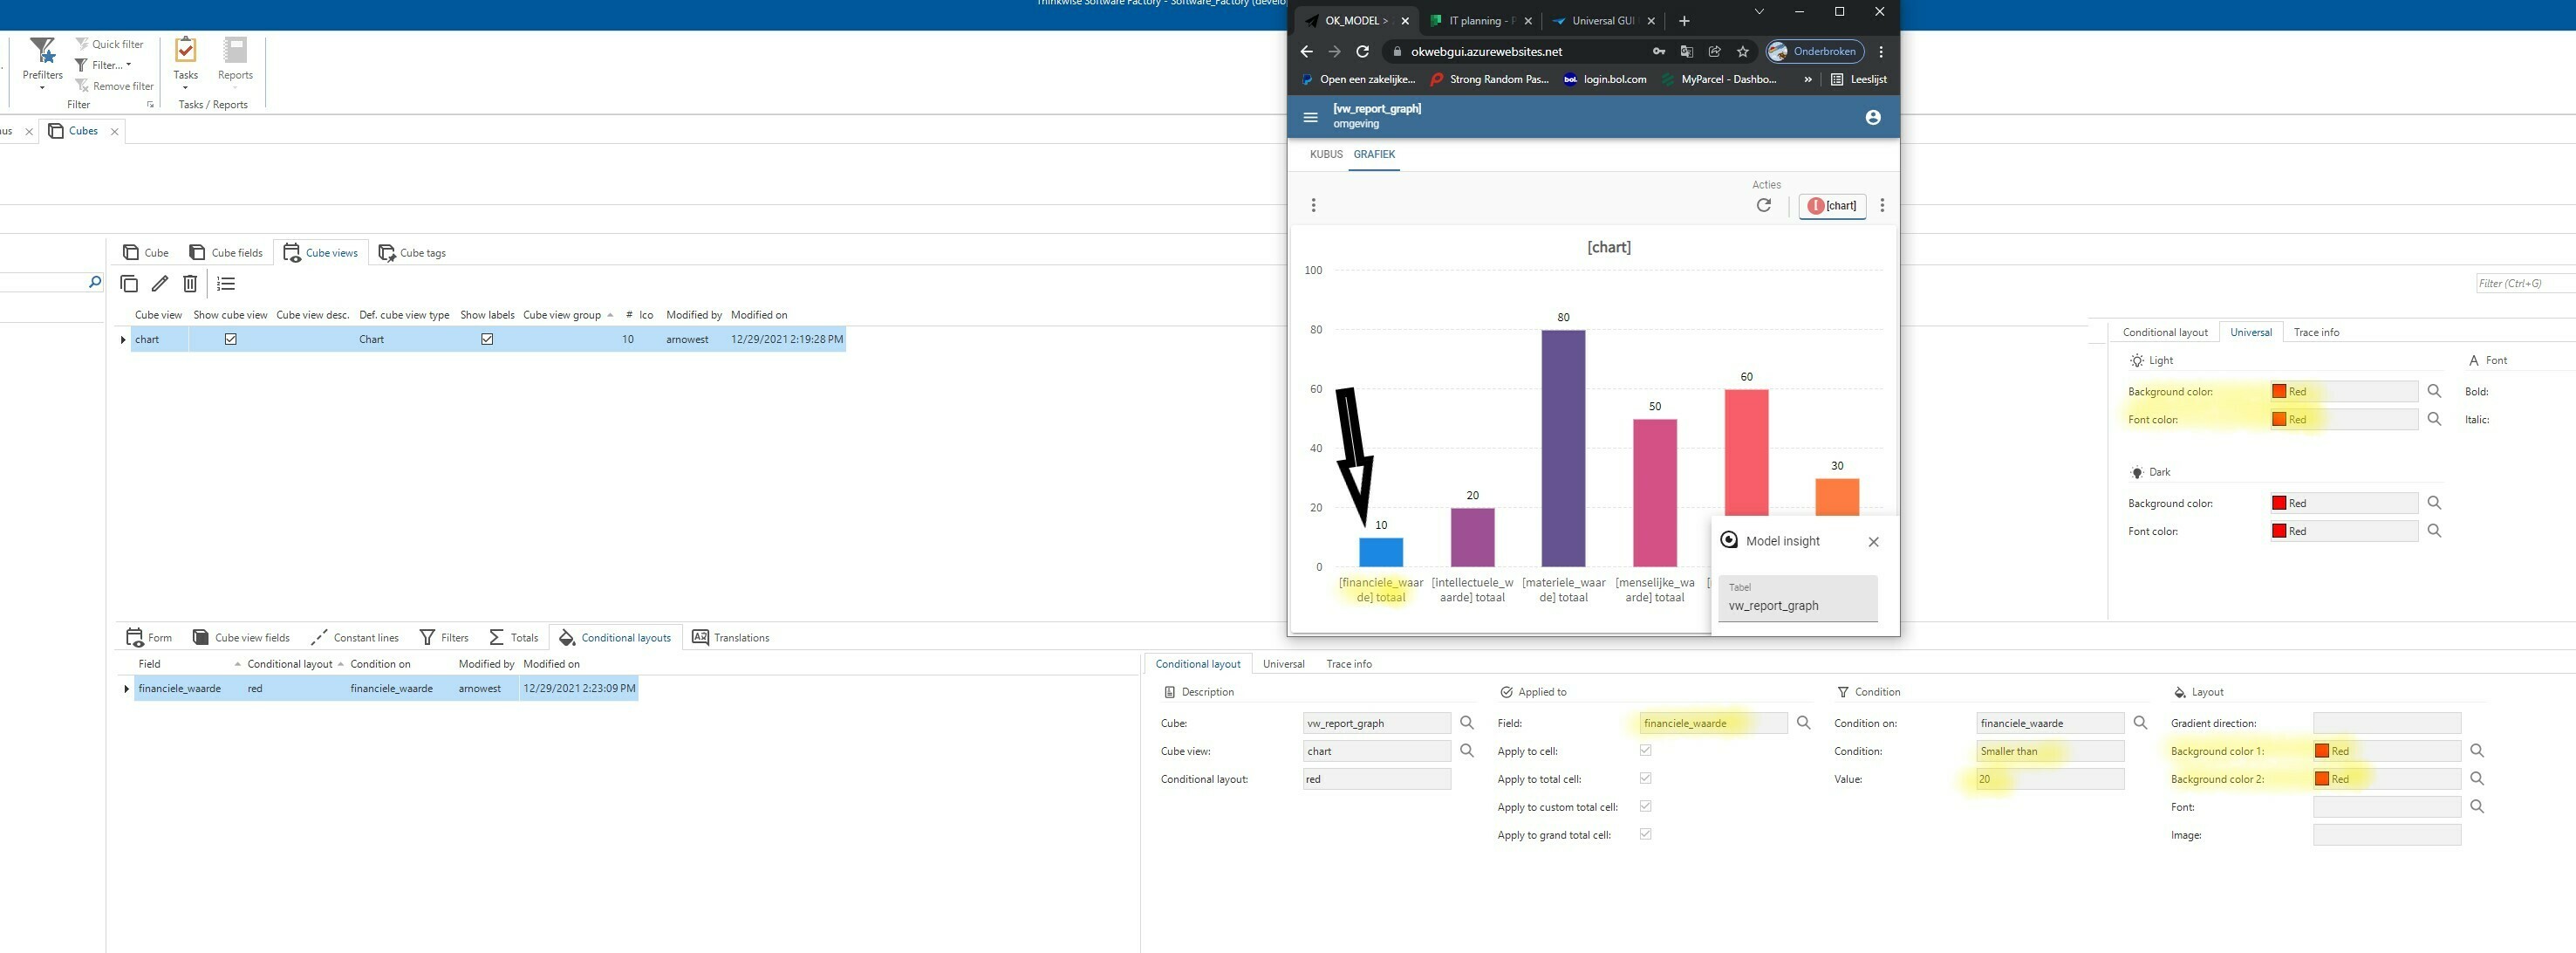
For a businesscase we have to set the color of a chart column to a specific color, based on the total amount. For example, when the column value <= 20 it needs to be shown in red.
I recently created a ticket for this on howto activate conditional formatting on charts, but it isn’t possible at the moment. I think this will be very usefull for other customers to.