I created a cube with view type chart and chart type 2nd line. We use the chart in the Universal UI. On the x-axis dates are shown and on the y-axis a value is shown. The data is visible when hovering over the dots on the line, e.g. “2021-10-01, 44.13K”. Is it possible to hide the dots on the line or disable the hovering feature so the user can not see the value?

Page 1 / 1
Try using custom CSS to hide the dots:
It would look something like this (replace table_name with the actual table ID. :
div[data_tab_id="table_name"] .fusioncharts-datalabels {
display: none;
}
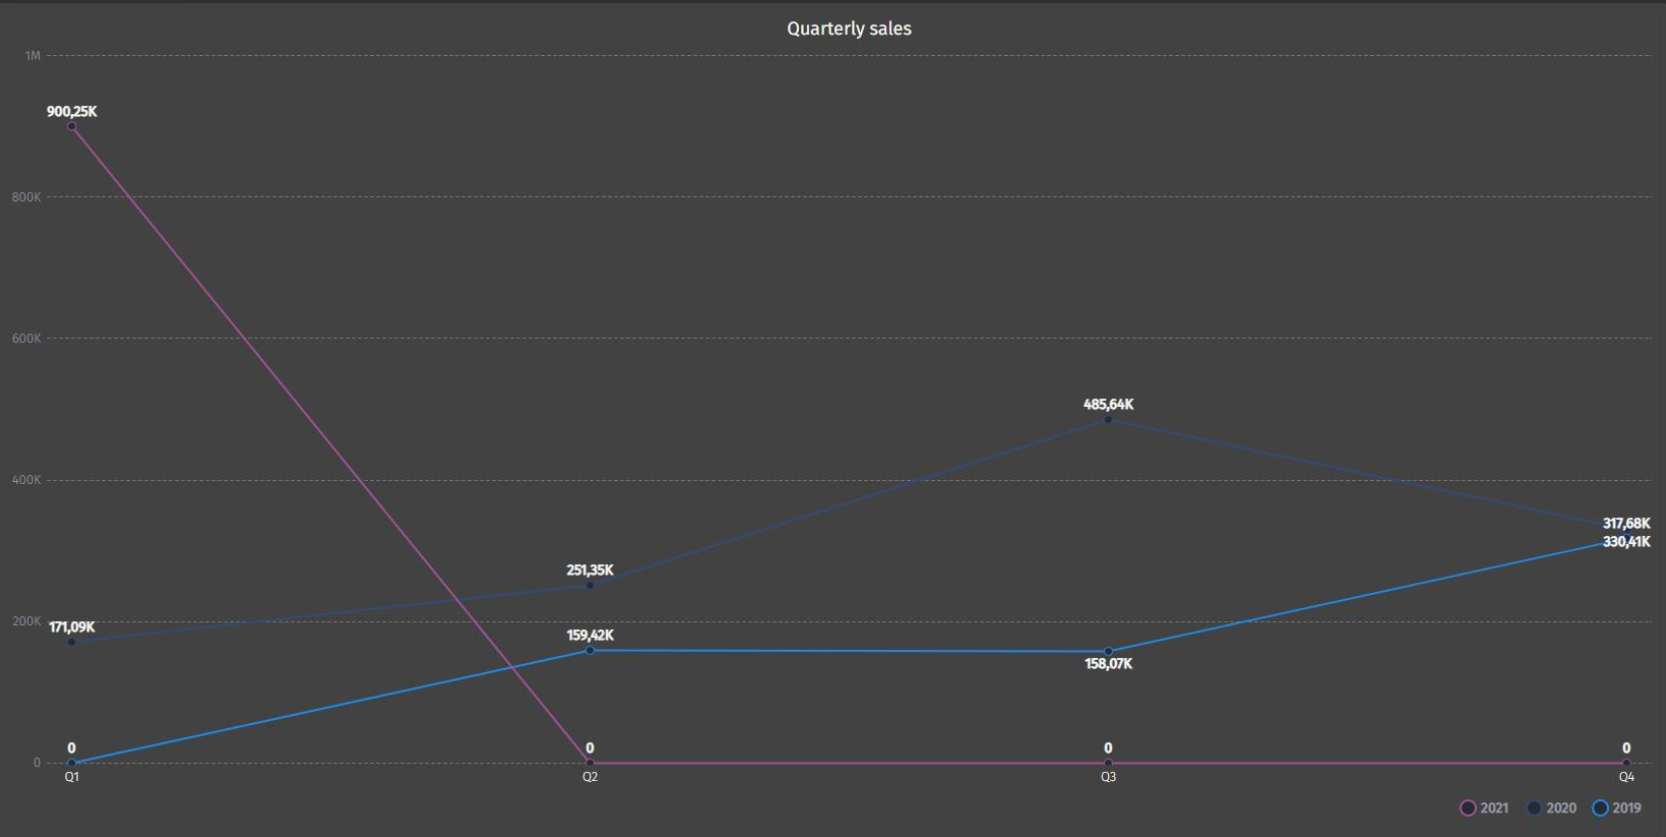
This will give you
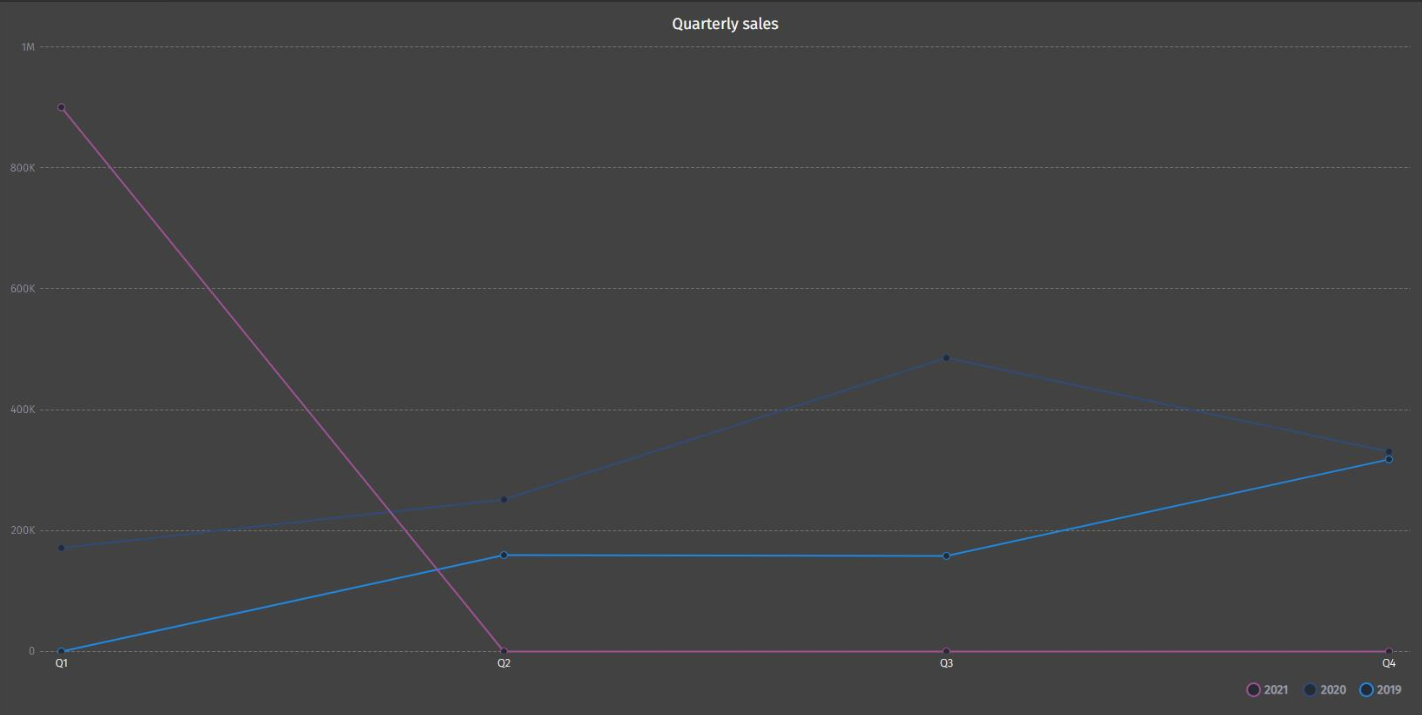
instead of
You must look for the class name of the label when hovering over the chart, and set that class to hidden in your css.
Then you will get something like this:
.fc__tooltip.fusioncharts-div{
    visibility: hidden!important;
}
Sidenote…
If TW changes the classname this won't work anymore, so it is a bit hacky.
Enter your E-mail address. We'll send you an e-mail with instructions to reset your password.