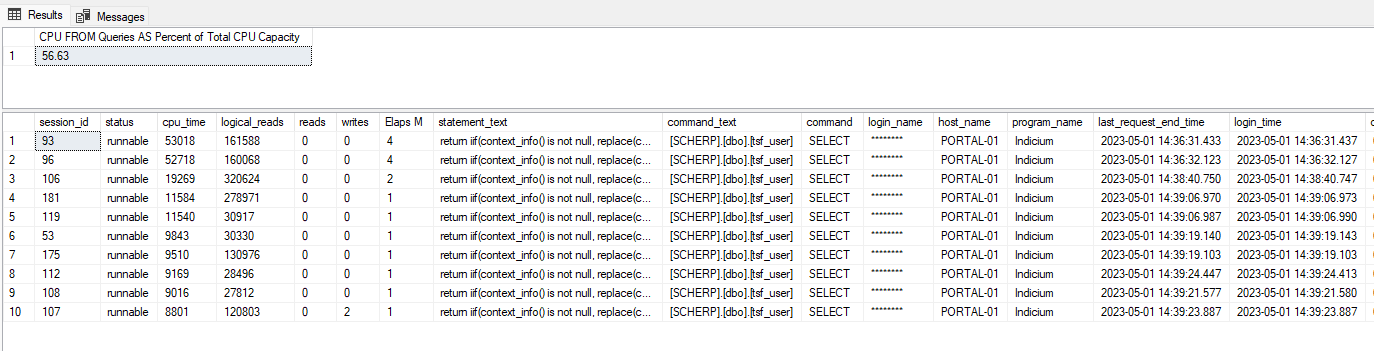
First of all, it is worth noting that the column command text in this query is not showing the command initiated by Indicium, but is constructed based on the object currently being executed.
It can be difficult to trace this problem to the actual command. There is, to my knowledge, not something like a 'stack trace’ that you can retrieve in which context the function is being called using dynamic management views.
The only way to find the query that's repeatedly calling tsf_user() and consuming all this CPU is by using the Query Store (I'm sure they'll show up in the Top Resource Consuming Queries) or really dive deep with the SQL Profiler / Extended Events.
Alternatively, you could perhaps consider altering the tsf_user() function to be inlineable. I'm pretty sure this will cause the ‘outer’ request not to make a separate query plan and request for the tsf_user() function. This requires at least SQL Server version 2019. Depending on the version of the Software Factory you are using, this would mean replacing with schemabinding with with inline = on in the function header code.