

I want to create a visualisation of a spider web based on the values of multiple criteria (see picture below). Is this possible with cubes? If so, how?
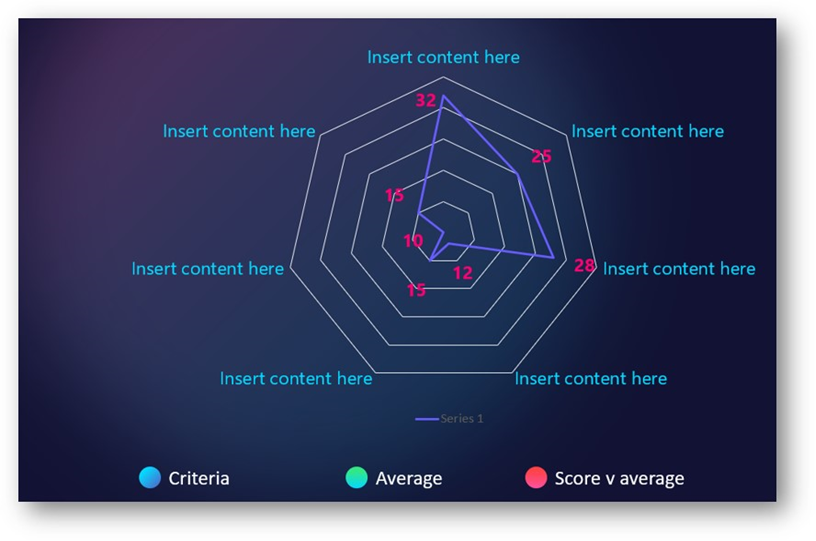

I want to create a visualisation of a spider web based on the values of multiple criteria (see picture below). Is this possible with cubes? If so, how?
Best answer by Freddy
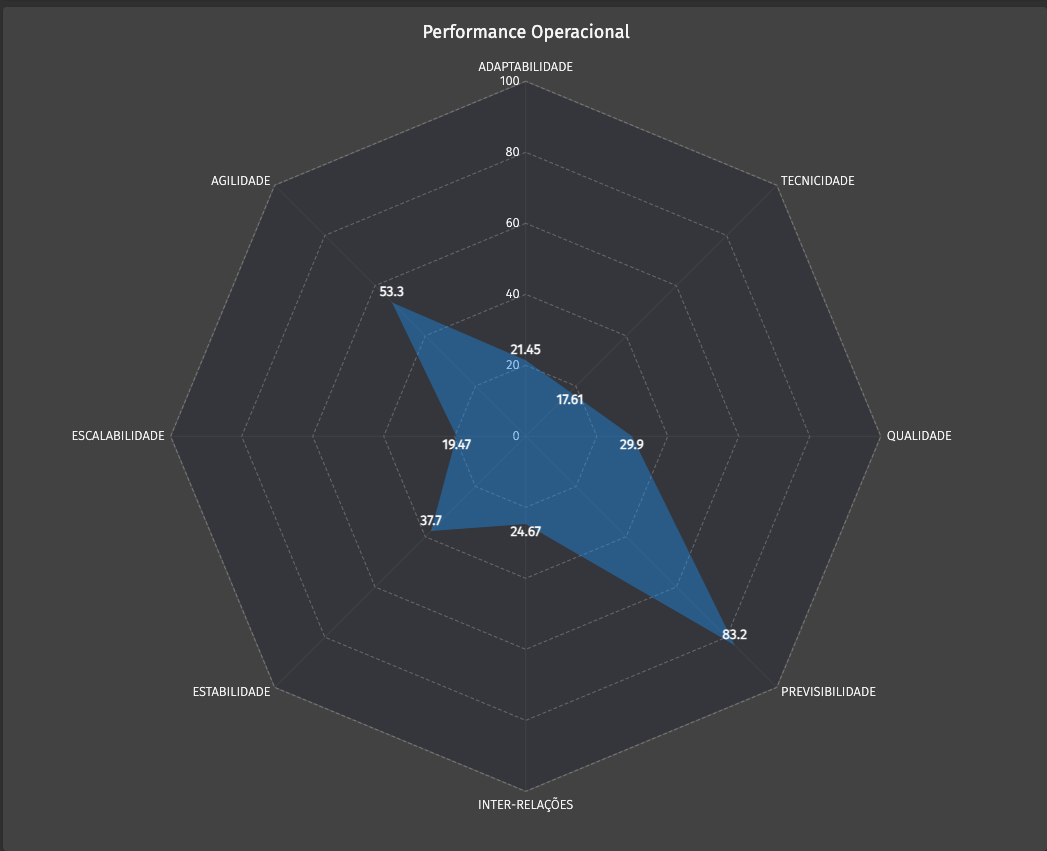
The area names as dimension (row), and productivity numbers as values (data) with chart type 2d radar area.
Enter your E-mail address. We'll send you an e-mail with instructions to reset your password.

