Trying to improve performance with thew Universal GUI where possible, I have encountered the COUNT(*) being a big issue in certain screens as well. Especially when people are filtering using the combined filter.
The way this filter works is already not very performance positive, but having the same call being done again to count the rows, makes the screen feel very sluggish. Certain searches take around 2.5-3.5 (maybe even more) seconds and that gets doubled by the extra call.
I think this call is intended for the paging mechanic (display # max records over all pages) or in combination with a “max. no. of records.” to (not) show the message exceeding result shows message.
Is there already a way to prevent this call from being made for specific views/tables?
In my example this would already gain a 2.5-3.5 seconds waiting for a result to show.
I agree. Can't the call be done and then count in the GUI the number of records.. So only one call is needed.
In the past I fiddled with the Subject settings and managed to get rid of this COUNT call if Pagination was disabled using 0 (or -1) for the Subject > Page size setting as described here: Settings for Subjects | Thinkwise Documentation (thinkwisesoftware.com)
That doesn't seem to work anymore, I assume it's a bug.
Also, it might be worthwhile for us to investigate whether we can combine the Record retrieval and Count calls into a single call (some suggested approaches are mentioned here: performance - Getting total row count from OFFSET / FETCH NEXT - Stack Overflow). Will follow up internally.
- The Count call actually is handled in parallel with the Data call, and the Universal GUI handles this Count call ‘lazily’ in our tests. Meaning the Grid will already show the Data and later add the Page numbers below. As such the Count call should not negatively impact the User Experience at the moment.
- We tested with a couple of approaches to combine the Count and Data call, but this will effectively make that single call take longer than the individual Data call. Since the separate calls can be handled in parallel and the Count call is handled ‘lazily’ by the GUI we won't go for combining these calls.
- Know that we also did extensive tests with FETCH OFFSET and alternatives like ROW_NUMBER, but it's pretty hard to optimize the performance of loading data on a high Page number without loosing flexibility for users to determine their own Sort order on Columns for example. We'll be looking at better Validations, more extensive Documentation on recommended approaches for optimizing data retrieval performance and changing/improving the User Experience for Filter/Sort/Search in such a way that the fastest methods are used the easiest by End users.
- I noticed in your ticket that you use a Max number of records setting. In that case we won't be able to get rid of the COUNT call, since it is also needed to determine whether or not to display below message. The bugfix you should expect is that the COUNT call is not needed if Max number of records is empty ánd Page Size = 0 (or -1)
I assume you are aware and have optimized this already, but the Combined search performance is improved if you:
- Restrict the number of Columns that it searches through
- Full-Text Index the Columns that it searches through
- If the Use case permits it, it might also be interesting to consider showing a small Filter form above some of your Grids instead of using the Combined search box. That way your End users will search in dedicated Columns and the performance will be better.
If there are other improvements you believe we could/should do, please do let us know!
We have tried a lot of changes and technically a filter form works better, but we cannot convince users to use it. They are all used to the Google search engine stuff, so one field to do everything :-(
I am still worried about the time it takes to do the loading/calling through the Universal GUI though. In this specific example my search action, if I execute the used query it takes far less than the Database event log measures.
On the database:
- Select = ~2.5 seconds
- Count = ~2.5 seconds
Database event log:
- Select = ~5.0 seconds
- Count = ~5.1 seconds
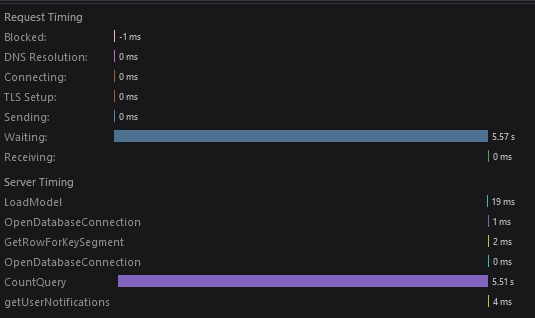
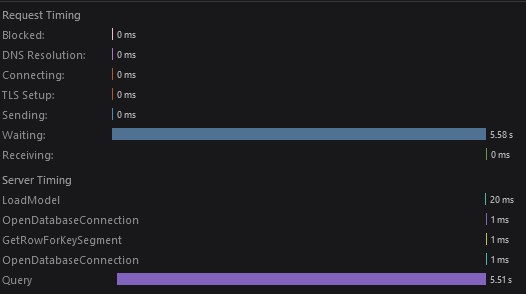
As they are indeed called parallel as you mention, they seem to be a combined time, so max 5.1 second.
In the Dev Tools it seems about right as they do a little extra data for references etc.:
Not saying I have the solution, but the use of the Universal GUI or in between components seem to factor quite a big loss in speed.
(I am actually curious if without the COUNT(*) call it would benefit around that 2.5 second or that this just coincidentally seems to be a value that is a normal delay with the Universal GUI.)
Your suggestions are appreciated and we have already applied them or tried them. At the moment we seem to be at the most optimal performance if we look at the database and minimum needs.
The question can be closed, but I am hoping some magic will turn up that can improve the performance. Perhaps in new updates or ideas. At least things we can control :-)
Hello
That's an interesting find, it definitely should not be the case that a request via Indicium takes considerably longer than the corresponding query would on the database. And I would definitely consider 2.5 seconds to 5 seconds to be a considerable loss of performance.
I have some questions to get to the bottom of this difference:
- When you say that simply running the query on the database takes 2.5 seconds, did you write the query yourself or did you copy the exact text from the Database Event Log?
- Did you run the query on the database while logged in as the same user on the database? If you're using IAM authentication or the user doesn't exist on the database, you can use this to simulate the logged in user for the tsf_user function. Note that this is only relevant when dealing with a view or prefilter that uses the tsf_user function.
DECLARE @binvar varbinary(128) = CAST('USERNAME HERE' AS varbinary(128)); SET CONTEXT_INFO @binvar;
- If you copy both query's from the Database Event Log and run them simultaneously (note: make sure that they aren't performed sequentially) on the database do you also notice that they both go from 2.5 seconds to 5 seconds? You can use
set statistics time on;
to measure the duration of a query. - Just to doublecheck the accuracy of the duration in the Database Event Log, could you also take a look at the Server timings for these two requests? You can find a Timings tab when you click on the request in your developer tools.
Looking forward to your reply.
1) I have copied the query from the Database event log. (the EXEC sp_prepexe...)
2) Technically the query is run by the pool user and I had connected to the DB myself with my own account. For confirmation I have tried it again today using the Pool user, but the results are the same. Luckily the query in question does not require a user context for it’s result as they are the same for all.
3) I am struggling to get them to run parallel and reading up on it, I see suggestions to put them in a job. This is however not an option in Azure. Any suggestion how I can run the statement parallel?
4) Here de screenshots of the timing:
Attempting your point 3 I am not able to achieve this, unless I use 2 account to connect (SSMS). When I do this they run about 2.5 each, so they are ready at around the same time.
Other attempts always give me the sum of the queries, as they’ll likely are being called sequential.
I even created 2 SP’s with a WAITFOR ‘delay’ of different times to see what the results of my test would be and they always summed, unless I ran them from 2 different accounts.
Thinking some more about the need for the COUNT statements, I have been thinking of an alternative when the Max. no. of records option is used. As count is still done for the situation that the limit is exceeded and a message needs to show to inform the user.
Idea:
What if you were not to use the COUNT but select tMax. no. of records] + 1. In the GUI you would only result the sMax. no. of records], but if your array were to contain the 1 additional record, you would know when to show the message or not. Technically it doesn’t matter of it would be 1 more of 1 million more records that are not visible to the user, but at least that would reduce a COUNT call to SQL.
I am not sure what the performance impact would be for the GUI or what technical challenges arise, but I can see in several cased in our application quite a big benefit were the COUNT not happening. This gain would obviously not be applicable if the GUI now needs the same amount of time to work with this idea.
Just throwing the idea out here in case it helps.
Instead of showing ‘There are more records that can be displayed’ which requires a count, we could also consider showing ‘The maximum number of records has been reached’.
This wouldn’t require a separate count query. It would show this message in the rare edge case where the number of retrieved records happens to be exactly the same as the configured max. number of records.
I am all for it!
Nevertheless, we did a bit of refinement with the Universal team and came to the below conclusions. Good to know is that the COUNT call is also used to display the number of records that would be exported when pressing ‘Export immediately’ in the overflow menu. With the below proposed changes we remove the number in the overflow menu.
Throwing it out here, so you know what to expect and to verify if this is aligned with your expectations. Let me know if not!
Principles:
- Desired behavior = Pagination in Universal GUI by default
- Desired behavior = Developers should be able to deviate from the default with as little effort as possible
- Desired behavior = reduce HTTP Calls where possible
Scenarios:
Page size | Max. no. of records | Actual records in table | COUNT call? | Expected behavior | Issue |
Null | Ignored | Irrelevant | Yes | Apply Pagination of 100 records per page |
|
X | Ignored | Irrelevant | Yes | Apply Pagination of X records per page |
|
<=0 | Null (Default also null) | Irrelevant | No | Show ALL records | Pagination is applied, this should not happen COUNT call happens, but should not |
<=0 | <=0 | Irrelevant | No | Show ALL records | COUNT call happens, but should not |
<=0 | X | <X | No | Show all records (since they are less than the Max no of records) | COUNT call happens, but should not |
<=0 | X | >=X | No | Show X records Show max_records indicator | COUNT call happens, but should not, determine whether or not to show the max_records indicator using the TOP call |
Desired changes:
- Max no of records = null should NOT apply Pagination if Page size <=0
- Eliminate as much COUNT calls as possible
- Show message indicator_for_reached_max_no_of_records based on the TOP call
- Change translation to '‘The maximum number of visible records has been reached”, this way it doesn't matter whether it is exactly the max or more than the max
- Export immediately: Don't show number of records there
- Export: Perform COUNT call upon opening the Export pop-up
Where we can we try to reduce unneeded calls, like disabling export functionality, but with the few changes that you offered, it would even help us some more.
I am happy with this openness in the communication.
Reply
Enter your E-mail address. We'll send you an e-mail with instructions to reset your password.