Solved

How to combine data from 2 tables in 1 a useable overview?

  • 16 February 2023
  • 2 replies
  • 104 views

Userlevel 5
Badge +12

Hi all, 

(Sorry for the Title, no clue on how to summarize the problem)

But some guidance is very welcome !

I have a table, with ‘Functions’. E.G, cleaner, driver, crane operator, etc. So, a person has a Function. I also have a table with ‘Tasks’. E.G. ‘Unload ship’, ’Clear deck’, ‘Load container’ . 

Each Tasks needs a number of Functions. Unloading a ship needs 3 unloaders, 1 cleaner and 1 driver.


So, this looks like this in very old software; on the left a column with all the Tasks, and in columns all the Functions. Here the user can specify how many of each Function is needed. Note; Functions can be created by the end-user, so it can be 4 or 182. Same of course for the Tasks.

“Replace your outdated software in 12 months with a modern progressive web application”

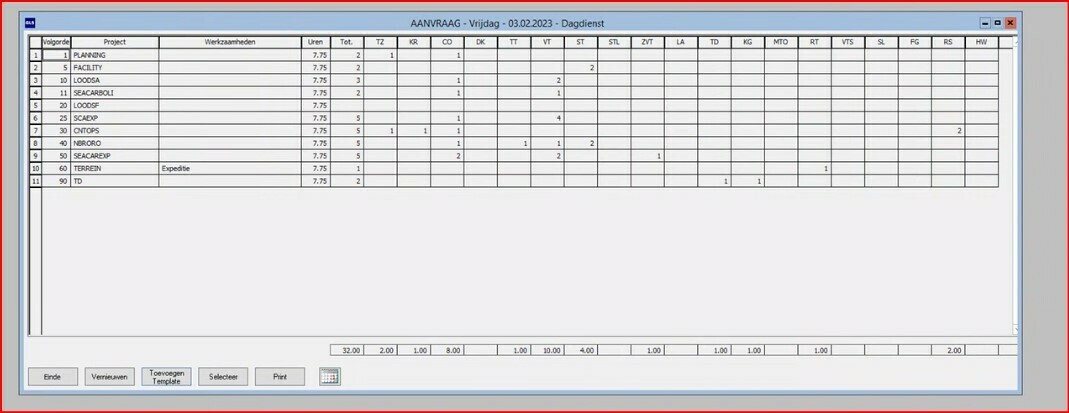
After entering all the values with how many people are needed per Task/Function, this needs to be saved somewhere. Not sure on the where and how of this.

How can something like this (no need to be an exact copy, but the usability needs to be same same) be developed for the Universal gui? 

Any advice on this is very welcome

Thnx! 

Alex 


icon

Best answer by Roland 6 March 2023, 20:45

View original

This topic has been closed for comments

2 replies

Userlevel 6
Badge +16

Horizontal flexibility is not something that is easily achieved within the SF, the only way I know of is by creating multiple views ranging from 4 to 182 columns. In the views you would map the table data in a horizontal pivot based on the number of rows. 

However its probably much easier to think how to create this in a row based solution. 

Userlevel 4
Badge +13

It looks like you need to put all your data in a cube. A cube is basically a pivot table with added functionality. First you'd have to structure the data into a simple list containing every combination of a function, a task and the number of people required. Possibly add a sequence number as well. This list of combinations can then be used as the basis for a cube and structured into the horizontal and vertical axes and the cells that contain the data for every combination. A cube has variable width, something that's quite a bit harder to achieve with a regular list in the gui.