Solved

Horizontal table entries in grid

  • November 14, 2022
  • 6 replies
  • 127 views

Sulea Ema
Vanguard
Forum|alt.badge.img+1

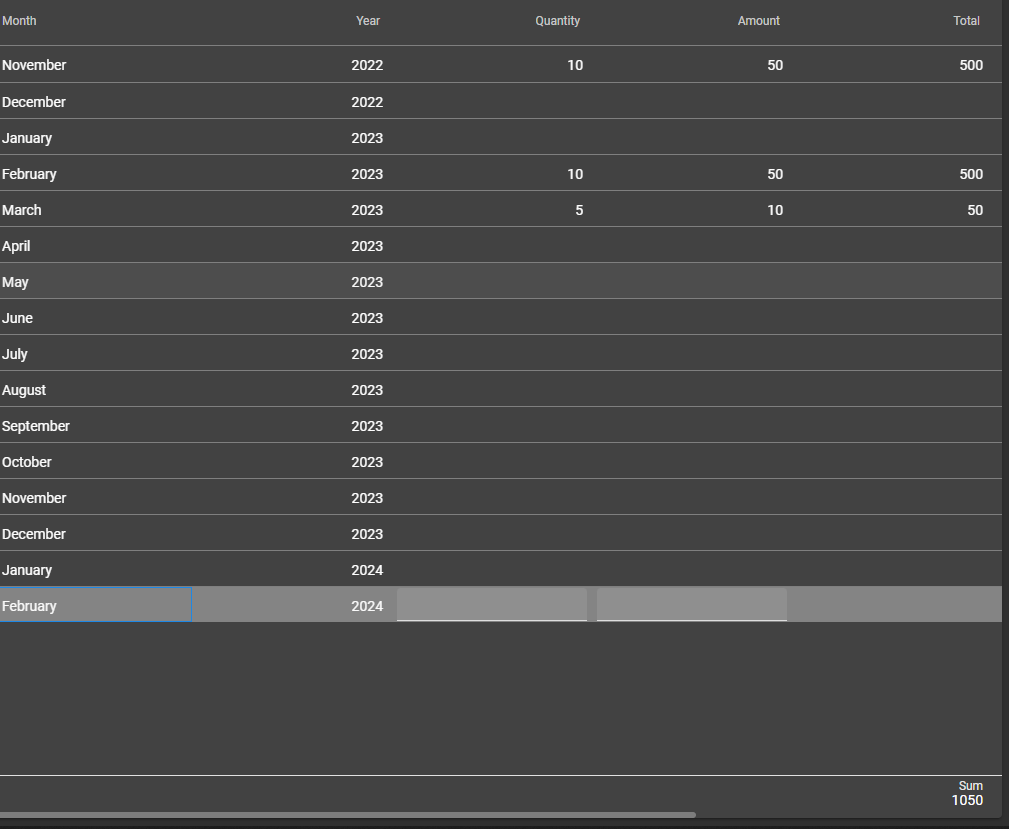
We wonder if there is a way to show the data in the grid horizontal fashion .This is how we do it now

grid vertical
 

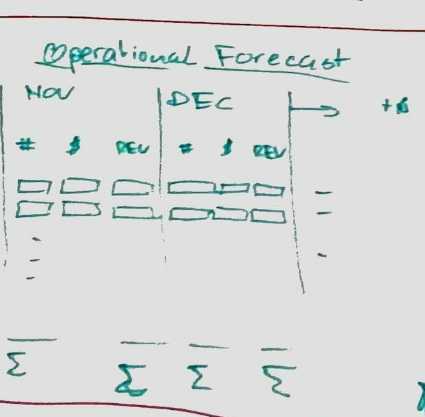
We want to show the data something like this :

horizontal grid 


Best answer by Mark Jongeling

Hi Sulea,

I can think of a couple of ways, but this exact overview is not obtainable I think.

You could create a View where months are columns too, such as month-quantity, month-amount, month-total for every month. Then put a Grid group header above these views with the respective month name. Leaving years as rows, you'll end up with a row per year.

Or vote on this idea of mine:

Maybe there are other ways, so I'll be curious to solutions of others here on the Community.

View original
Did this topic help you find an answer to your question?
This topic has been closed for comments

6 replies

Mark Jongeling
Administrator
Forum|alt.badge.img+23
  • Administrator
  • 3936 replies
  • Answer
  • November 14, 2022

Hi Sulea,

I can think of a couple of ways, but this exact overview is not obtainable I think.

You could create a View where months are columns too, such as month-quantity, month-amount, month-total for every month. Then put a Grid group header above these views with the respective month name. Leaving years as rows, you'll end up with a row per year.

Or vote on this idea of mine:

Maybe there are other ways, so I'll be curious to solutions of others here on the Community.


rbiram
Hero
Forum|alt.badge.img+4
  • Hero
  • 75 replies
  • November 14, 2022

You could look into PIVOT fuctionality.


Sulea Ema
Vanguard
Forum|alt.badge.img+1
  • Author
  • Vanguard
  • 16 replies
  • November 14, 2022

@rbiram in SF what type of functionality should I use to create that pivot table?


Mark Jongeling
Administrator
Forum|alt.badge.img+23

You can create a view and use PIVOT (info) inside its Control procedure template code.

PIVOT rotates a table-valued expression by turning the unique values from one column in the expression into multiple columns in the output. And PIVOT runs aggregations where they're required on any remaining column values that are wanted in the final output. 

From: https://learn.microsoft.com/en-us/sql/t-sql/queries/from-using-pivot-and-unpivot?view=sql-server-ver16


Sulea Ema
Vanguard
Forum|alt.badge.img+1
  • Author
  • Vanguard
  • 16 replies
  • November 14, 2022

Thank you @Mark Jongeling !


Freddy
Forum|alt.badge.img+16
  • Thinkwise Local Partner Brasil
  • 528 replies
  • November 14, 2022

Or, at least for Universal, you wait for the editable cube to function. Then you can show your existing list in different forms depending if you put a dimension as a row or column. 


Cookie policy

We use cookies to enhance and personalize your experience. If you accept you agree to our full cookie policy. Learn more about our cookies.

 
Cookie settings