
I created a cube with view type chart and chart type 2nd line. We use the chart in the Universal UI. On the x-axis dates are shown and on the y-axis a value is shown. The data is visible when hovering over the dots on the line, e.g. “2021-10-01, 44.13K”. Is it possible to hide the dots on the line or disable the hovering feature so the user can not see the value?

Solved
Hide dots on cube chart in Universal
- Apprentice
Best answer by Erwin Ekkel
Try using custom CSS to hide the dots:
It would look something like this (replace table_name with the actual table ID. :
div[data_tab_id="table_name"] .fusioncharts-datalabels {
display: none;
}
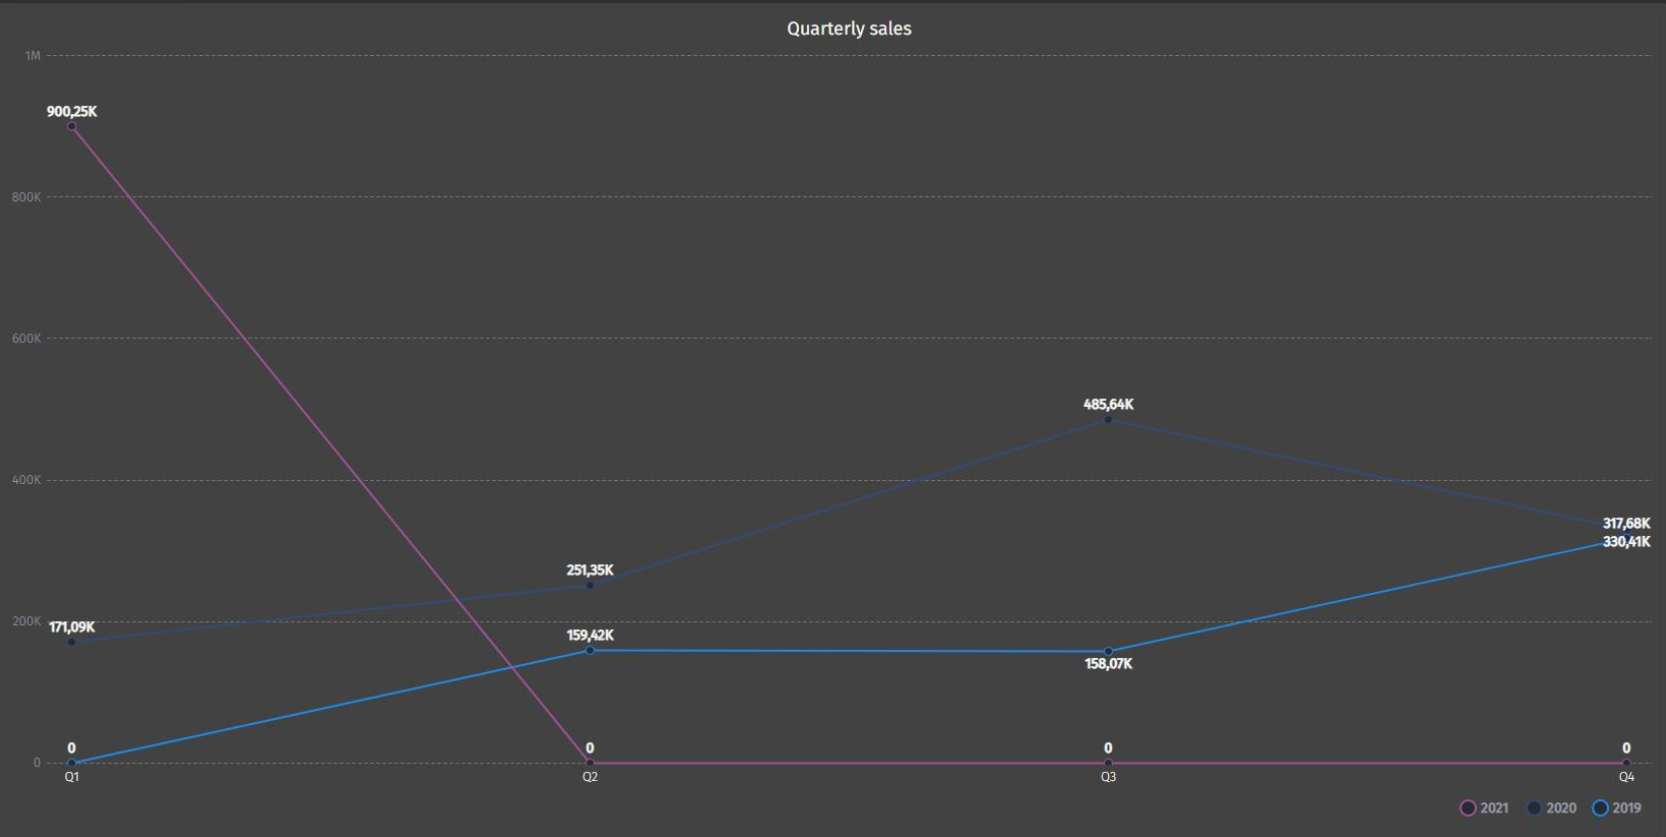
This will give you
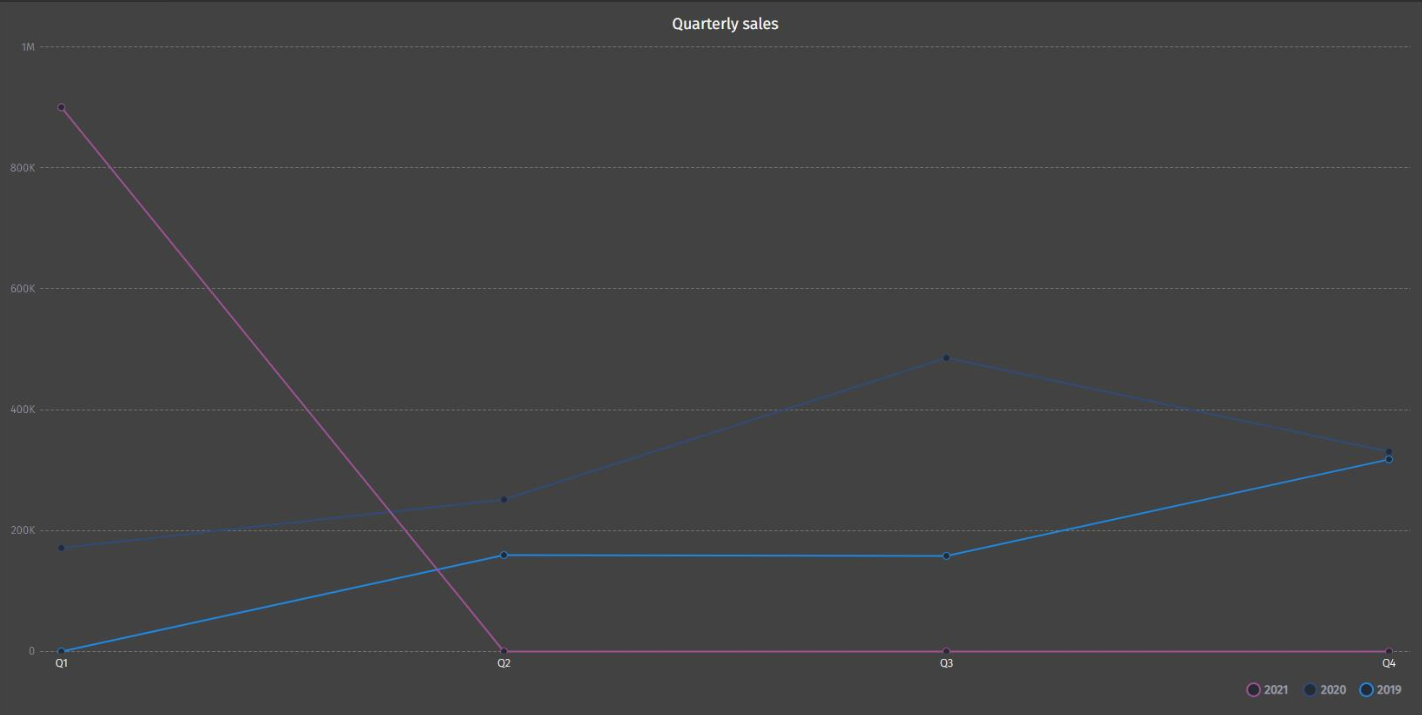
instead of
This topic has been closed for replies.

Enter your E-mail address. We'll send you an e-mail with instructions to reset your password.