Hello everyone, we want to have some kind of graphic presentation of data (dates) in a way that dates are on the X-axis and the values on the Y-axis. Is there any specific screentype or we need to create a cube with a type for it? Any suggestions?
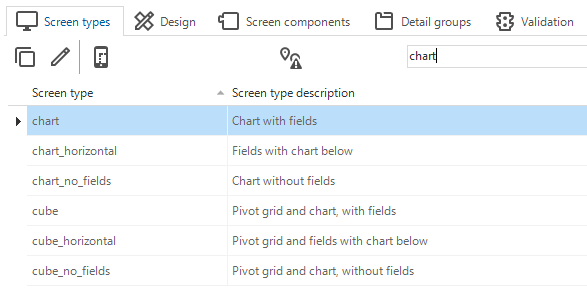
To show a cube in a screen, the screen type needs the Chart screen type component. The Software Factory provides a Chart screen type by default. You only need to assign it to the table/view that contains the data that needs to be presented.
Chart screen types
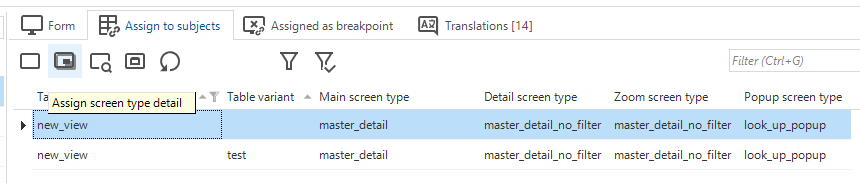
Assign the screen type using the tasks on the right side of the Screen type screen:
Assign screen type as Master and/or Detail screen type
To show a cube in a screen, the screen type needs the Chart screen type component. The Software Factory provides a Chart screen type by default. You only need to assign it to the table/view that contains the data that needs to be presented.
Chart screen types
Assign the screen type using the tasks on the right side of the Screen type screen:
Assign screen type as Master and/or Detail screen type