Question

Debugging API requests

  • January 9, 2026
  • 6 replies
  • 83 views

Forum|alt.badge.img

Hi, when building an api call I usually use Bruno for quick developing and testing the overall structure. However when (re)building in Thinkwise I face a few issues that, in my opinion, could be easily addressed.

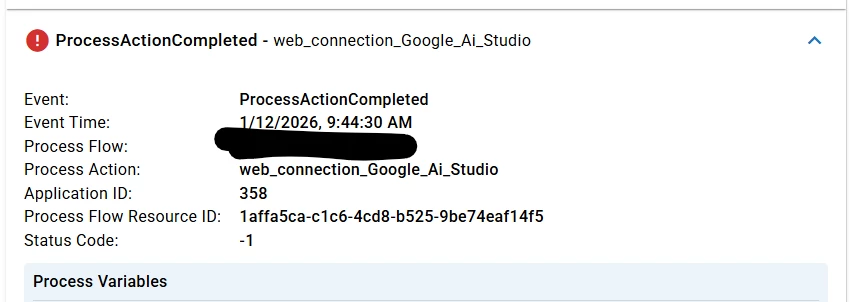
1/ The overall debug data within the process flow monitoring does not show my original outgoing request (?) and there seems to be no other location where this debugging data can be recovered. 

2/ For some reason I am unable to test my development work without creation \ sync. Some parts like read file connector seem to not be working at all directly running from sf. This, in combination with 1, is causing a lot of additional time during development / debugging. 

Could one give me some pro tips how to properly handle API development inside Thinkwise? 

6 replies

Forum|alt.badge.img+2

Hi Martin,


I think Bruno is a fine tool to test the api’s. When you say you cannot find your original ‘outgoing’ request, do you mean the api request that triggers the api? So outgoing from Bruno and incoming for the SF?


For a read file connector it should not be necessary to generate and sync to make it work. However, after you change something, you would need to tell Indicium to refresh the model, and since there is no client, you would also need to make a call to make Indicium do that.


You can do this with Bruno

POST: <https://your-server>/indicium/sf/<appl_id>/refresh_model

no body.


Forum|alt.badge.img

Hi Sebastiaan, thanks for your reply. 

What is mean is after setting up the initial testing in Bruno I created the web connection and setup in Thinkwise. In this case a post to Google Ai Studio. Thinkwise has a way of sending the call to my endpoint, however I can not find the outgoing message send to that endpoint. 

The current debugging looks like this:


And this: 
 

Process flow logging 2#


And more 
 

Error Log Details


It would be (max) helpful if the real communication flow used in API calls can be viewed for debugging. The current way of making it work can be painfully frustrating as every change / test comes with a creation followed up with the indicium sync. 

If there is a better way to develop test API’s please do educate me


Forum|alt.badge.img+2

I’m still not sure why you need to sync it. But if you open the debug center, from Universal via the user menu. Or by entering the path in the url of your browser. https://path-to-you-application/indicium/debug-center

Then go to the process flow monitor tab. 

Trigger the process flow.

You should be able to find the process flow there. when you click on it a side panel opens. There you find the step that does the web connection. And that should have a block called debug data with the actual information you are looking for in it.

It looks something like this;


And this debug screen also has a refresh model trigger. Because I still think that is all you would need to do.


Forum|alt.badge.img+3

Hi Martin,

In your case, the “Debug Data” section won’t show probably because something goes wrong before sending the request. At least in your screenshot where it says: Misused header name, ‘Content-Type’.

Did you add a Content-Type header to Web connections → Endpoint → Request headers?
Can you remove that one? Because you probably also have assigned one in Endpoint → General (under the “Settings” group which Indicium also adds.

It would help if you could provide some screenshots of your configuration.


Forum|alt.badge.img

Hi Dick, thanks for highlighting Content-Type  out. I did figure that issue out with some help of online ai tools looking over my shoulder. 

Also I figured out an other vital thing Thinkwise was not clear about. In this case Google Ai Studio expected the url to be like this: 
https://generativelanguage.googleapis.com/v1beta/models/{{GEMINI_MODEL}}:generateContent

In order to make it work I finally placed the ‘:’ inside the base url as from within ‘Path’ this resulted in 404 errors. 


All and all the debugging api calls was not made easy.. So, my main question remains: When making an external request where in the debug / logging can the full composed JSON that is being complied & send from within Thinkwise be (re)viewed? 


Forum|alt.badge.img+2

Martin,

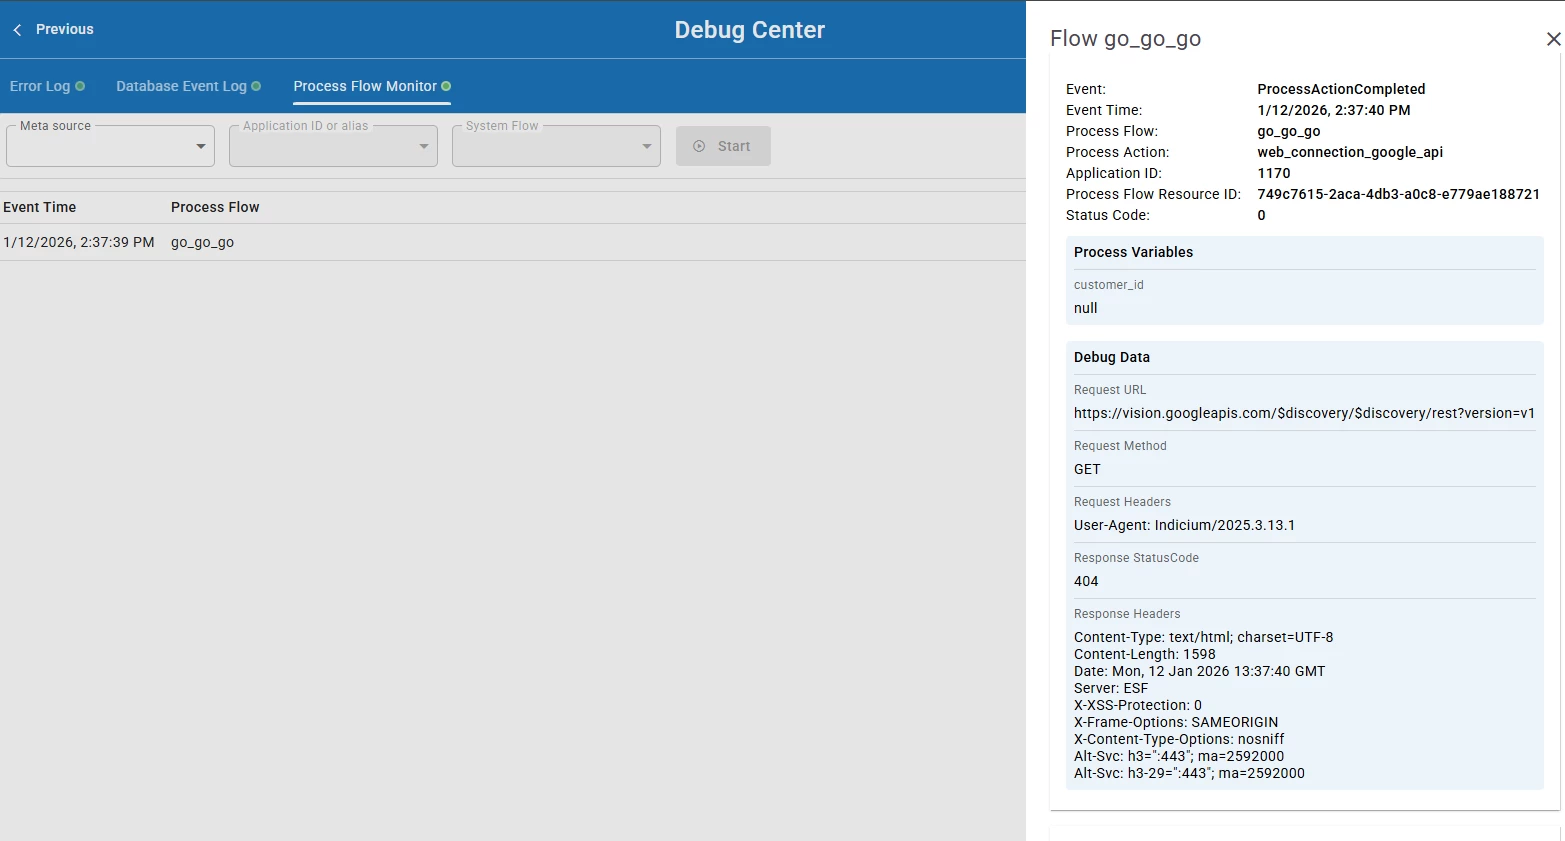
There is logging in the place that we pointed out, the process flow monitor. In my example, there was no JSON body because it was a GET request. But if you look at a successful POST request, then there would be a body.

A web request is not completely made of JSON. This panel shows every part that makes up a request. If you decide to put JSON in it, that should be in the Request body. 

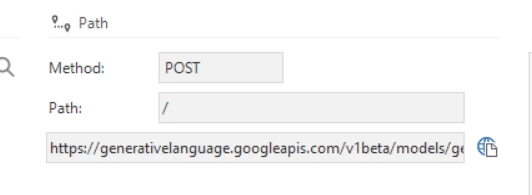
The block Debug data has;

Request URL, Request method, Request Headers, Request body (if applicable), Response status code, Response header. 

All the components that make up an HTTP request should be there. If the request body JSON is not in there, in your case, could you send us a screenshot of this panel for a POST request where this was missing? It could be a bug. The only known thing that would not be there is MultiPartForm.