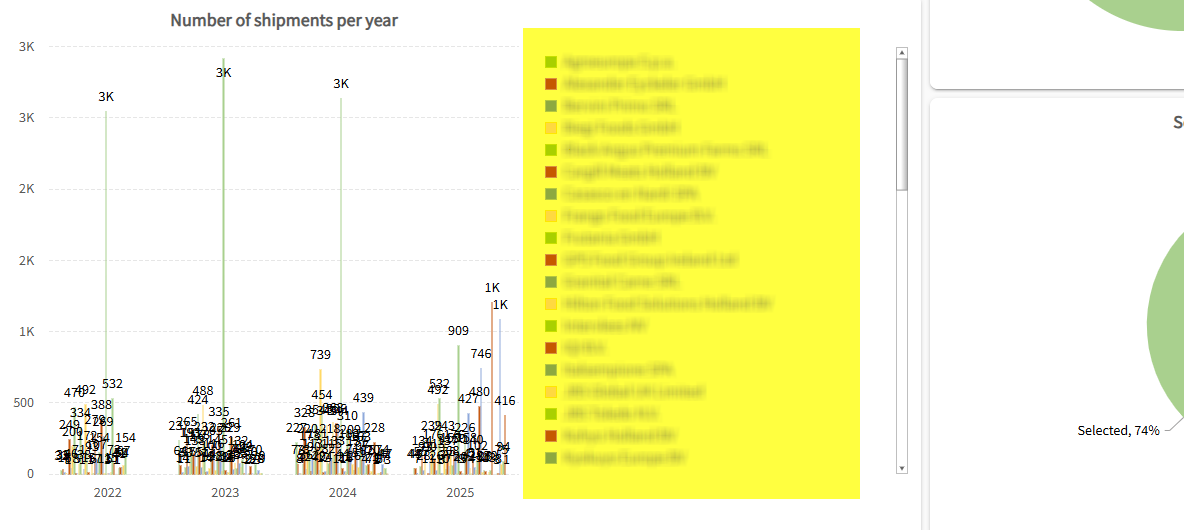
I'd like to ask for any suggestions. We're creating a cube chart to represent Company, Volume/Number of Shipments, and Year.
Is it possible not to display all values by default when the page loads? We'd like to add filters, such as by Company or Year, instead of showing everything at once.
Right now, the chart displays all company values, and it looks cluttered. If there's a way to apply filters, that would really help with clarity.
This chart will be one of the key items on our dashboard, so we need it to provide statistical insights into shipment volume.
Best answer by Erik Brink
Hallo Erwin,
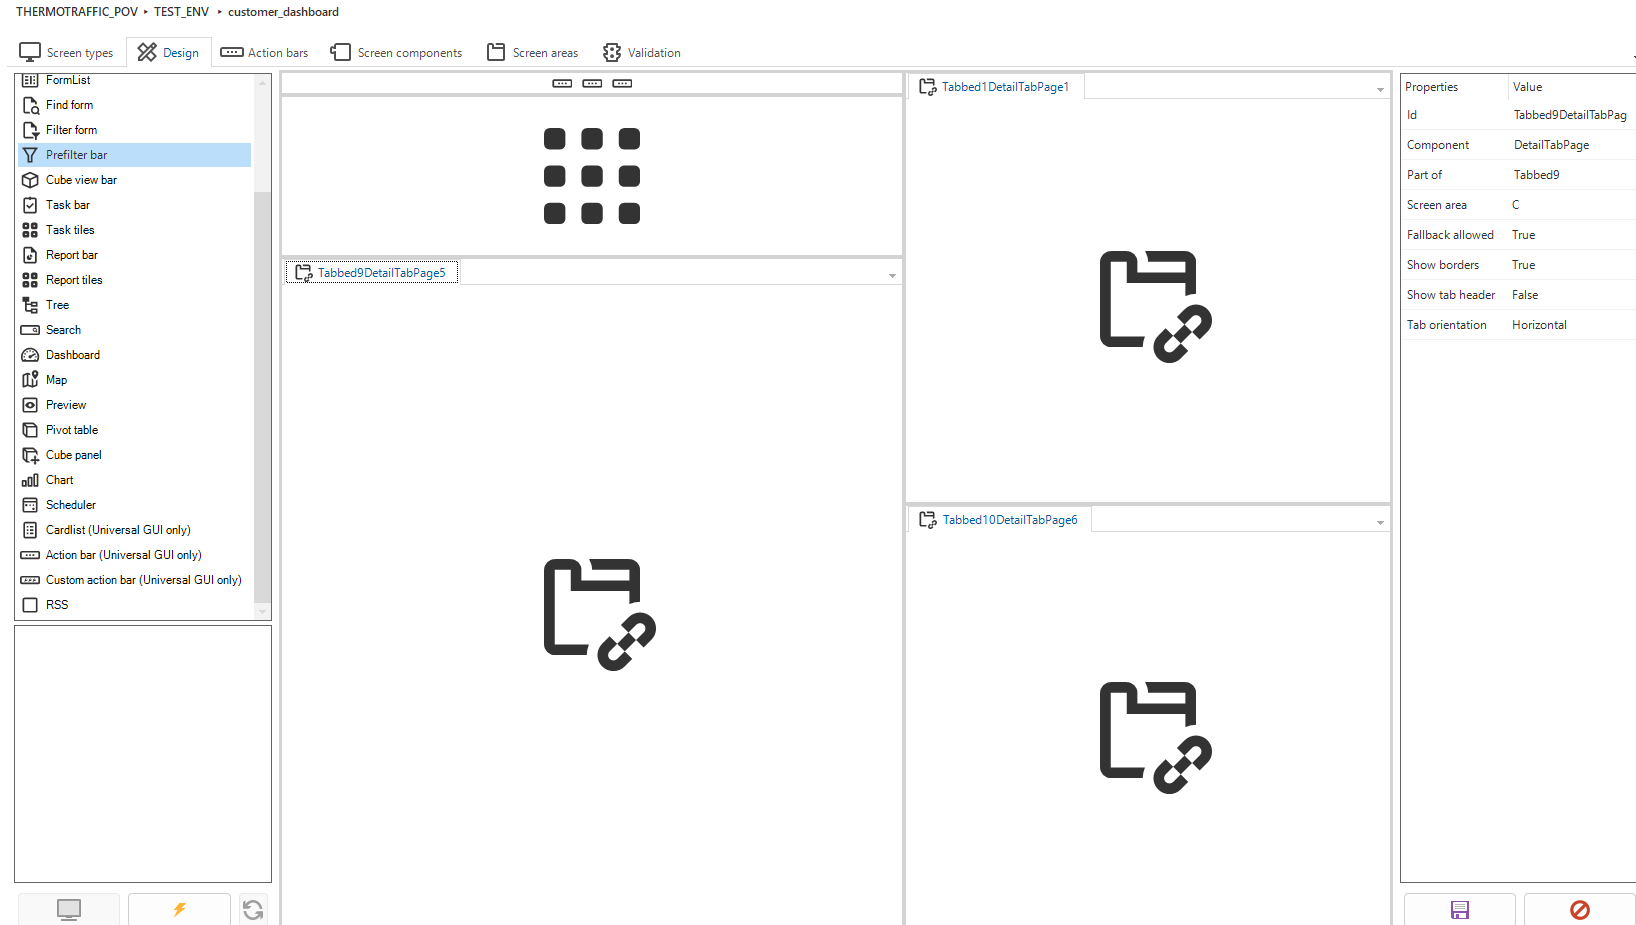
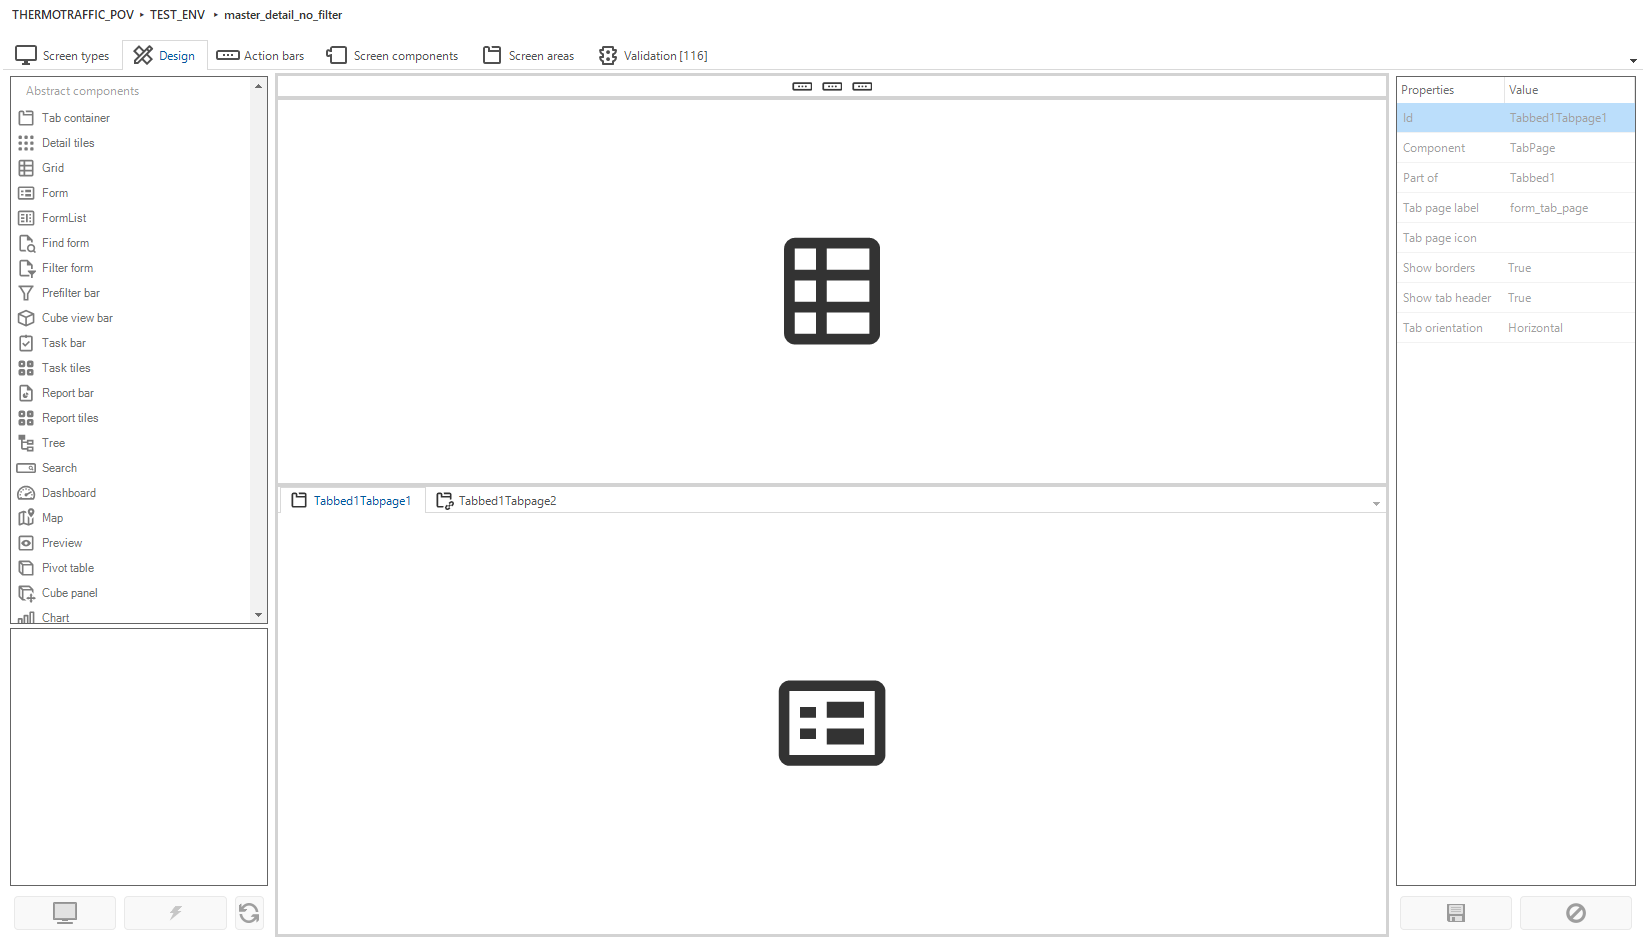
Here's my screen type, because the module is a dashboard so there's a different components.
Possible to put Prefilter bar or action bar in the tab detail page? I'm trying to drag in tabbed9 but it doesn't work. or you have another suggestion to fulfil my requirement?
...
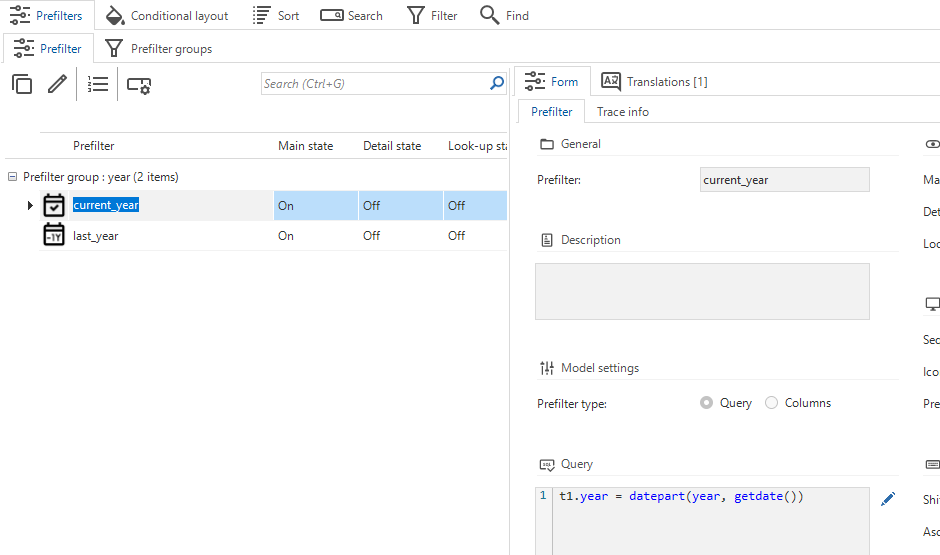
On each tab I'm planning to add a prefilter like I mention on top We'd like to add filters, such as by Company and/or Year, instead of showing everything at once.
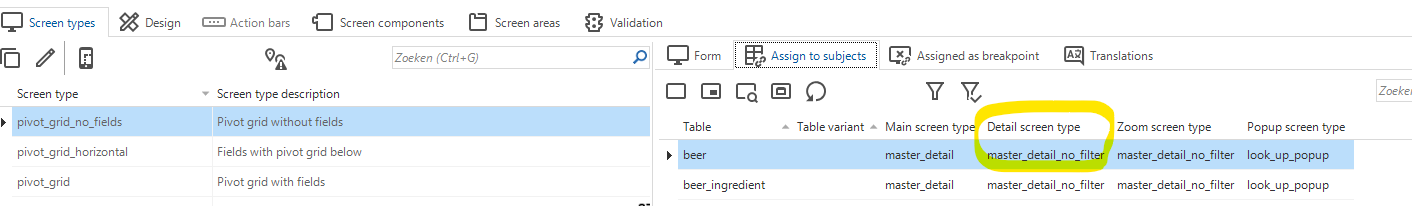
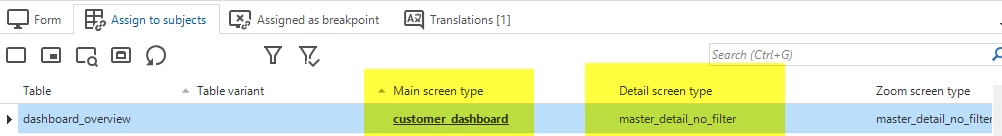
To add a prefilter to a detail tab, you have to go to the screentype of the detail subject assigned to “tabbed9”. The prefilter should also be attached to the detail subject.
Adding filtering possibilities to the pivotgrids’ categories, series and values is on our planning. And will also be applied to the belonging chart. We hope to deliver this soon. Please keep an eye on our release notes for that.
Here's my screen type, because the module is a dashboard so there's a different components.
Possible to put Prefilter bar or action bar in the tab detail page? I'm trying to drag in tabbed9 but it doesn't work. or you have another suggestion to fulfil my requirement?
Also does creating a Task can be applied in cube?
On each tab I'm planning to add a prefilter like I mention on top We'd like to add filters, such as by Company and/or Year, instead of showing everything at once.
Here's my screen type, because the module is a dashboard so there's a different components.
Possible to put Prefilter bar or action bar in the tab detail page? I'm trying to drag in tabbed9 but it doesn't work. or you have another suggestion to fulfil my requirement?
...
On each tab I'm planning to add a prefilter like I mention on top We'd like to add filters, such as by Company and/or Year, instead of showing everything at once.
To add a prefilter to a detail tab, you have to go to the screentype of the detail subject assigned to “tabbed9”. The prefilter should also be attached to the detail subject.
Adding filtering possibilities to the pivotgrids’ categories, series and values is on our planning. And will also be applied to the belonging chart. We hope to deliver this soon. Please keep an eye on our release notes for that.