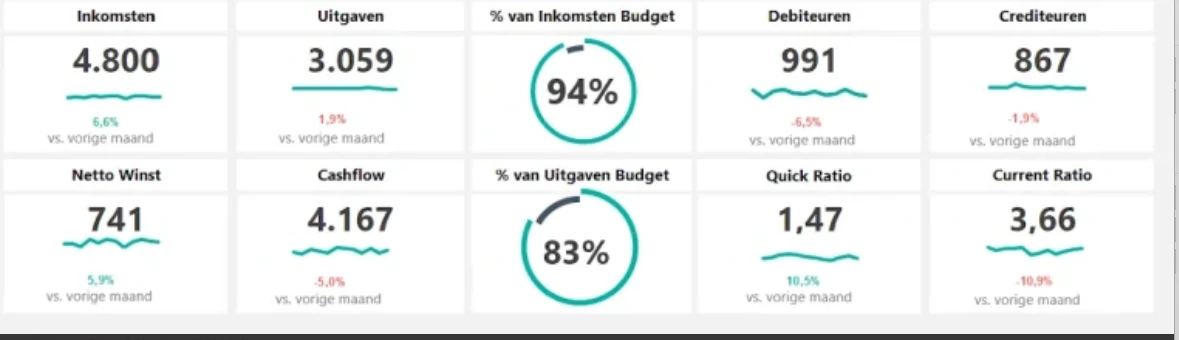
Would like to check what is the best approach to create a dashboard, similar to the example below—that displays key metrics such as the number of products, total units, total amount, etc.
Would it be advisable to create a view table to support this?
Also, what would be the recommended method to display this in large tiles?
From the logic of the custom component you can directly send data request to the Indicium API to gether the required data. If a view is helpfull to simplify the OData requests, feel free to use that to. Indicium well expose that as an end-point too.
The custom component can interact with the surrounding Thinkwise UI as described in the link above.
This is a high-code solution, so if you need help with that, please contact you Thinkwise consultant.
Hi Erik,
Noted for suggestion, but I think it might be a bit complex.
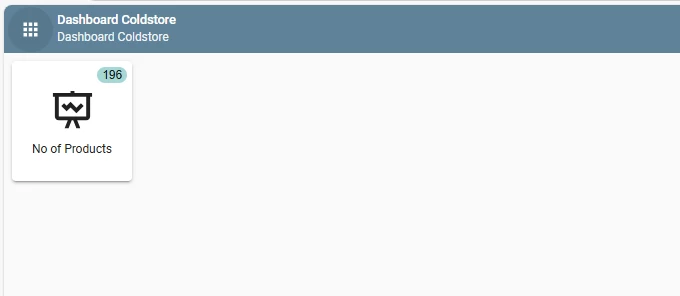
I think for now just a simple task tile with badge that would indicate the statistic would work.
I tried to create a task tile as below, and create a badge function.
Currently, I’m running into an issue when trying to filter, for example, filter by “Coldstore.” I haven’t created a view table for this , so my plan is just to create separate badge functions and tasks for each tile I need (e.g. no of units, total weight, etc..) .
However, I’m unsure where exactly to add the filter logic. A guide would be appreciated if there is.