Solved

Charts in Universal

  • 29 December 2021
  • 5 replies
  • 190 views

Userlevel 3
Badge

Hello! 


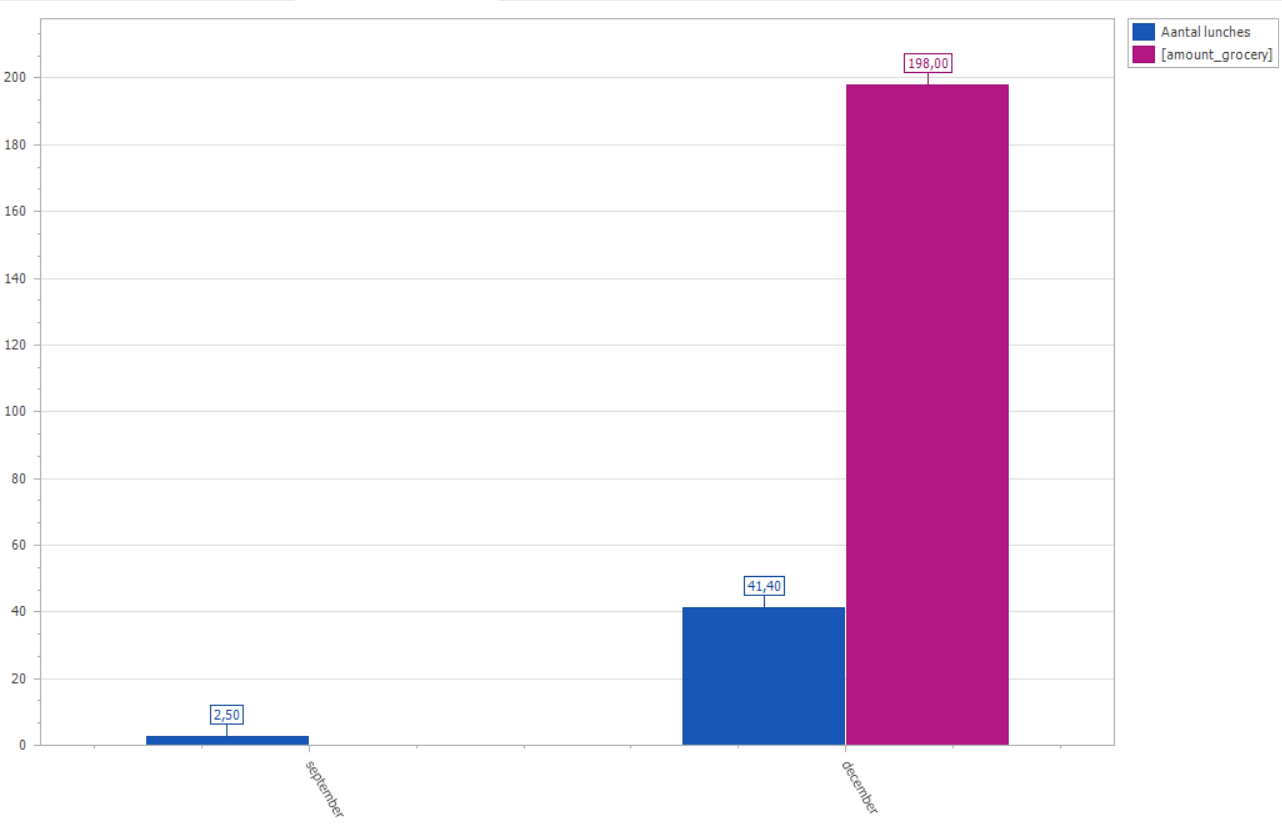
I'm trying to implement a chart in Universal. Unfortunately I get the message: 'This chart type is not supported'. In the Windows gui it does show the charts. Is there an overview somewhere of which chart types are supported? 


icon

Best answer by Erwin Ekkel 30 December 2021, 15:02

View original

5 replies

Userlevel 6
Badge +16

Currently universal supports all area types, bar, line, spline, stepped line, stepped area, single series pie and dougnut. I will create a ticket to have this list added to the documentation. 

Userlevel 3
Badge

Thank you for your reply Erwin. 

I have chosen the chart type '2d bar (side by side)'. It was allready like this so that was set correctly i asume from your answer. 

I also have the following settings:

  • Def. cube view type: Chart
  • Show cube view: is marked with the check box on
  • Chart type: 2d bar (side by side)
  • Palette: Northern Lights
  • Show labels: is marked with the check box on


It works in the Windows Gui. It looks like this: 


It looks like i've got the right Chart type. Is there anything else that could cause it to not work in the Universal Gui?

Userlevel 6
Badge +16

The universal charts currently do not support date functions like month and year. Try setting the month field to any other field and it should work. We have a backlog item to make the use of date functions compatible with universal in a future release. If you need it right now you could create a custom view to create the date parts within the view and not within the cube. 

Userlevel 4
Badge +4

Group Interval Date doesn’t seem to be working still? I’d like to get rid of the T00:00:00 and only show the date. I’m a bit surprised it even shows this since the domain is DATE and not DATETIME(2)
 

Being able to show the a date in a chart is basic functionality and I wonder why this has not been fixed yet (Or I might be doing something wrong).

Userlevel 5
Badge +16

Group Interval Date doesn’t seem to be working still? I’d like to get rid of the T00:00:00 and only show the date. I’m a bit surprised it even shows this since the domain is DATE and not DATETIME(2)
 

Being able to show the a date in a chart is basic functionality and I wonder why this has not been fixed yet (Or I might be doing something wrong).

@Marius Korff yes the date notation, has been this horrible since the start..  however the latest U-GUI should have improvements (didn't check it yet).. 


Reply