A lesser-known feature of Indicium is its capability to automatically log to Azure Application Insights. This service can be used for monitoring Indicium live. You can, for example, inspect failed requests, monitor response times, or investigate exceptions.
Read the example below to learn how Azure Application Insights can help you in the development process. Especially when you don't have direct access to Indicium's error logs, having such logging capabilities is extremely useful. But even when you have direct access to the log files, the extra features offered by Azure Application Insights make it worth enabling it.
Setting up Azure Application Insights
This feature is enabled by default, but to use it, you need a paid Azure account with Application Insights enabled as a resource.
Once you have everything set up in Azure, the next step is to find your Application Insights instrumentation key and add it to Indicium's appsettings.json.

"ApplicationInsights": {
	"InstrumentationKey": "actualinstrumentationkey"
}
Similar to the standard logging, you can control the logging levels by adding the following to the appsettings.json file:
"Logging": {
  "ApplicationInsights": {
    "LogLevel": {
      "Default": "Information",
      "System": "Information",
      "Microsoft": "Warning",
      "Indicium": "Debug"
    }
  }
More information about the different logging levels can be found here.
Using Azure Application Insights
Here's an example of how you can use Azure Application Insights to inspect failed requests.
In your Azure Application Insights resource, the first screen you will see is the overview. This overview features several graphs about your application's performance, as you can see in the next image.

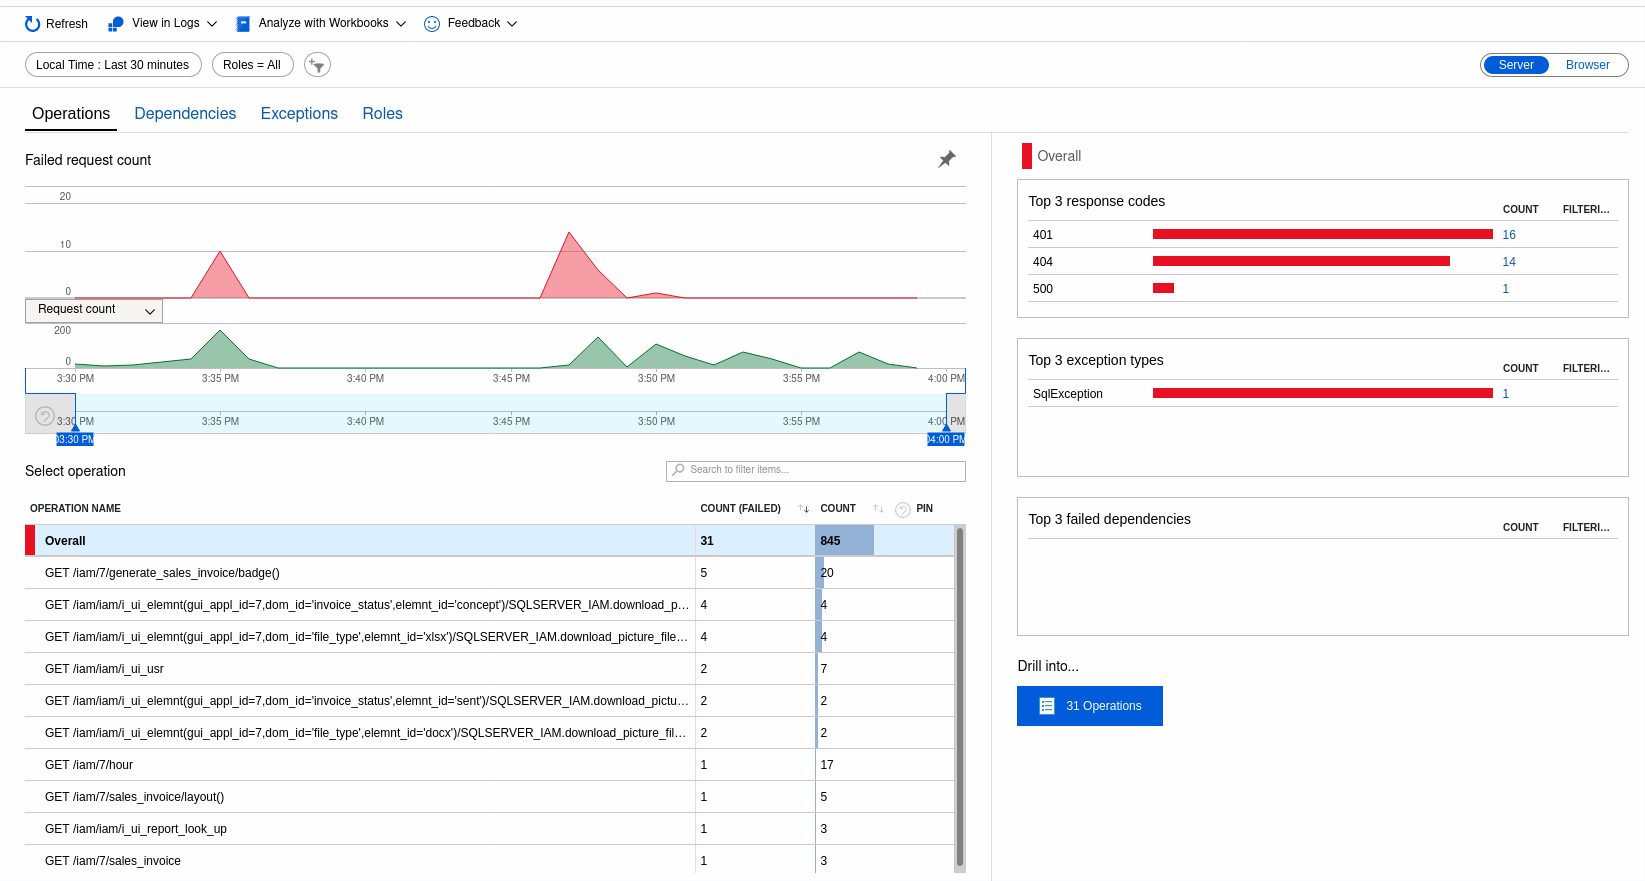
It shows that there were some failed requests. Now Application Insights can help you to investigate these failures. When you click on the Failed Requests graph, you will be sent to the following screen:

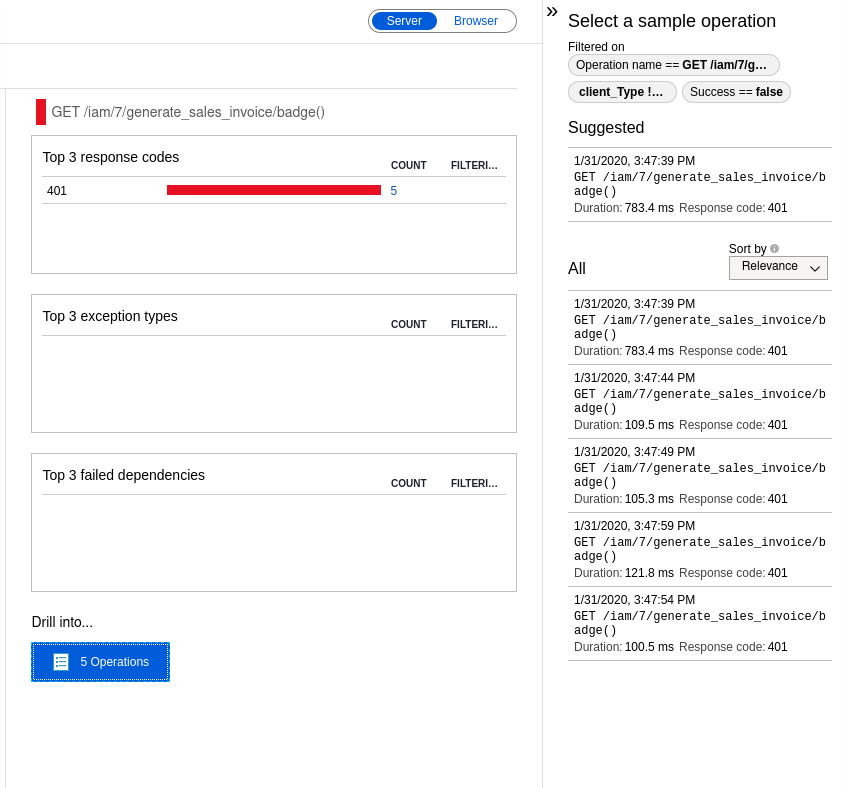
This screen gives you an overview of all failed requests within a certain time interval, the last 30 minutes in this example. The request with the highest number of failures seems to be a GET request for a badge on generate_sales_invoice. When you click on the request, you can get more detailed information.

In this case, Indicium is returning a 401 Unauthorized response code for this resource.
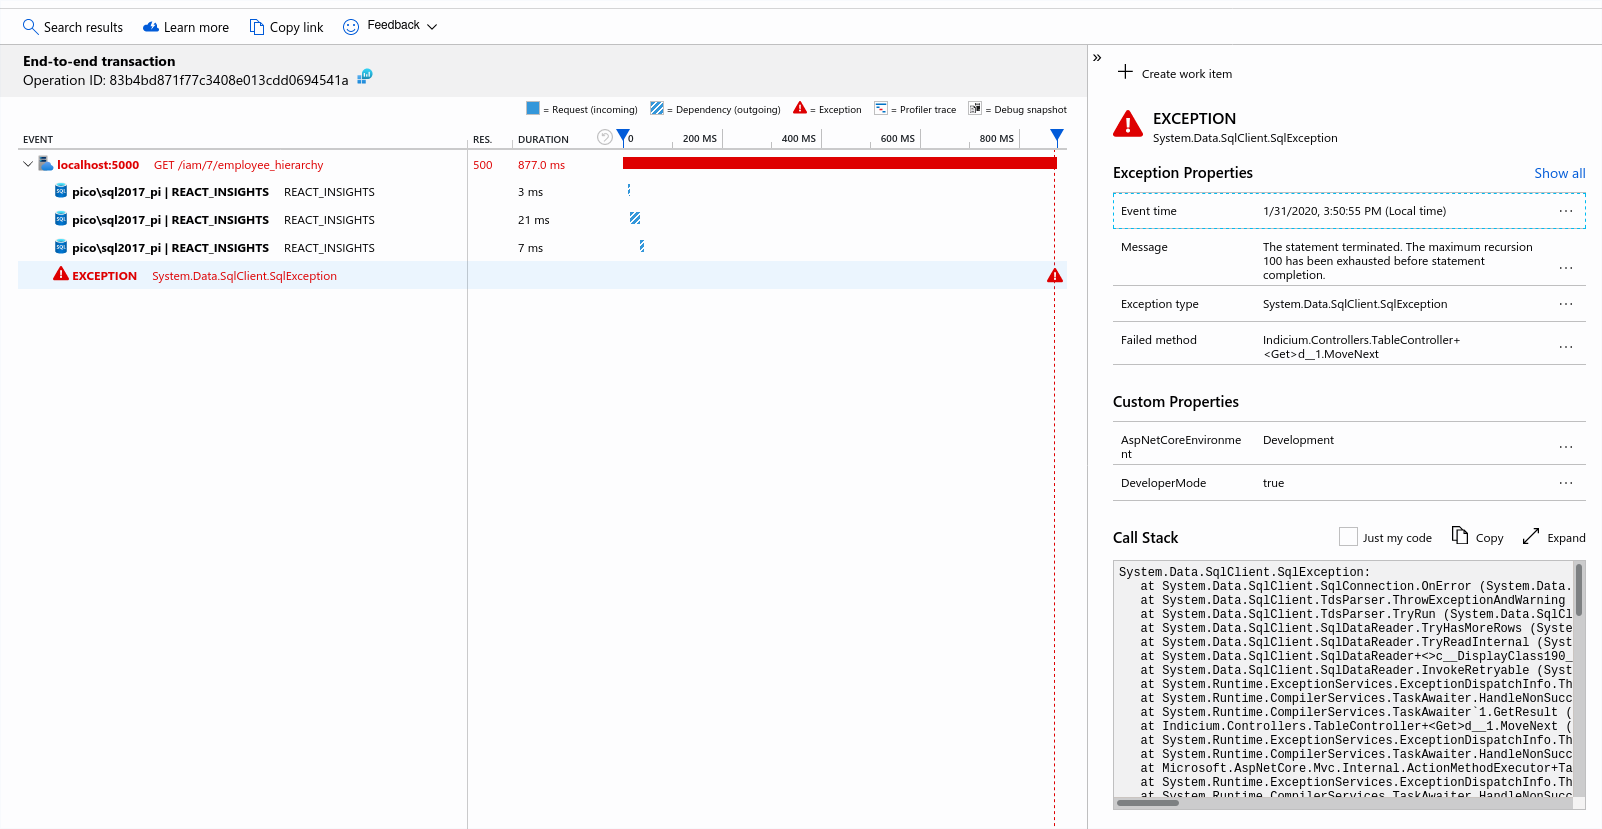
Something else worth investigating is the logged SqlException. By going to the Exception tab and clicking on the exception message on the right of your screen, the next screen opens, giving highly detailed information about the exception.

This screen shows you one of the advantages of debugging with Application Insights. Not only the SqlException is shown with a full stack trace, but it also gives you an overview over time about what has led to the actual exception.
In this example, the exception is preceded by a GET request on the employee_hierarchy resource. Apparently, while processing the request, some piece of SQL code is giving a maximum recursion error.
With this information, you now know there must be a problem in an SQL template. As it turns out, the problem is caused by the employee_hierarchy view. This view is using a recursive cte that seems to end up in an infinite loop.
Sounds interesting?
In the Thinkwise Docs, you can always read back this information, plus a lot more about deploying Indicium.


