




Last quarter, this screen opened in a second. Now the user clicks, and waits, and watches the spinner turn for twenty. Nothing in the model changed. Nobody rewrote a query. The data did the damage on its own: the Orders table quietly swelled from fifty thousand rows to two million, and a query that never needed an index suddenly, badly does. This is how performance problems often arrive. Not with a bang or an outage, but as a slow drift that users feel in every click, long before anyone thinks to open a query plan.
Performance problems rarely have a single cause, and fixing them rarely takes a single technique. This blog walks through the checks and habits that make the biggest difference, in the order you would actually apply them. You start by ruling out infrastructure and structural issues, then work inward: the smoke tests, the tables and views behind your subjects, and the cubes and queries that have to stay fast as data volumes grow.
Before you start. Universal UI and Indicium ship a new release every month, and those releases stay backwards compatible with every supported platform version. You can run the latest Universal UI and Indicium (2026.2.12) on an older platform version such as 2025.3 and still benefit from every runtime improvement. Always run the latest Universal UI and Indicium. For the details, see the Thinkwise lifecycle policy.
Understand the architecture before you tune
If you are in the process of transitioning from the Windows GUI to the Universal UI, it pays to understand the difference between a 2-tier and a 3-tier architecture, and what it does to the performance of your application. A query that was optimized for the Windows GUI is not always the right solution for the same screen in the Universal UI.
The way the two architectures load data, page through large datasets, and split work between client and server is covered in detail in Transition to the Universal UI in the Thinkwise documentation. What matters for performance is that a query tuned for the Windows GUI is not automatically the right one for the same screen in the Universal UI, so measure before you assume.
Network latency. Because the Universal UI works over the internet, it is sensitive to network latency. Optimizing your network and cutting latency pays off directly. A few web server settings do most of the work:
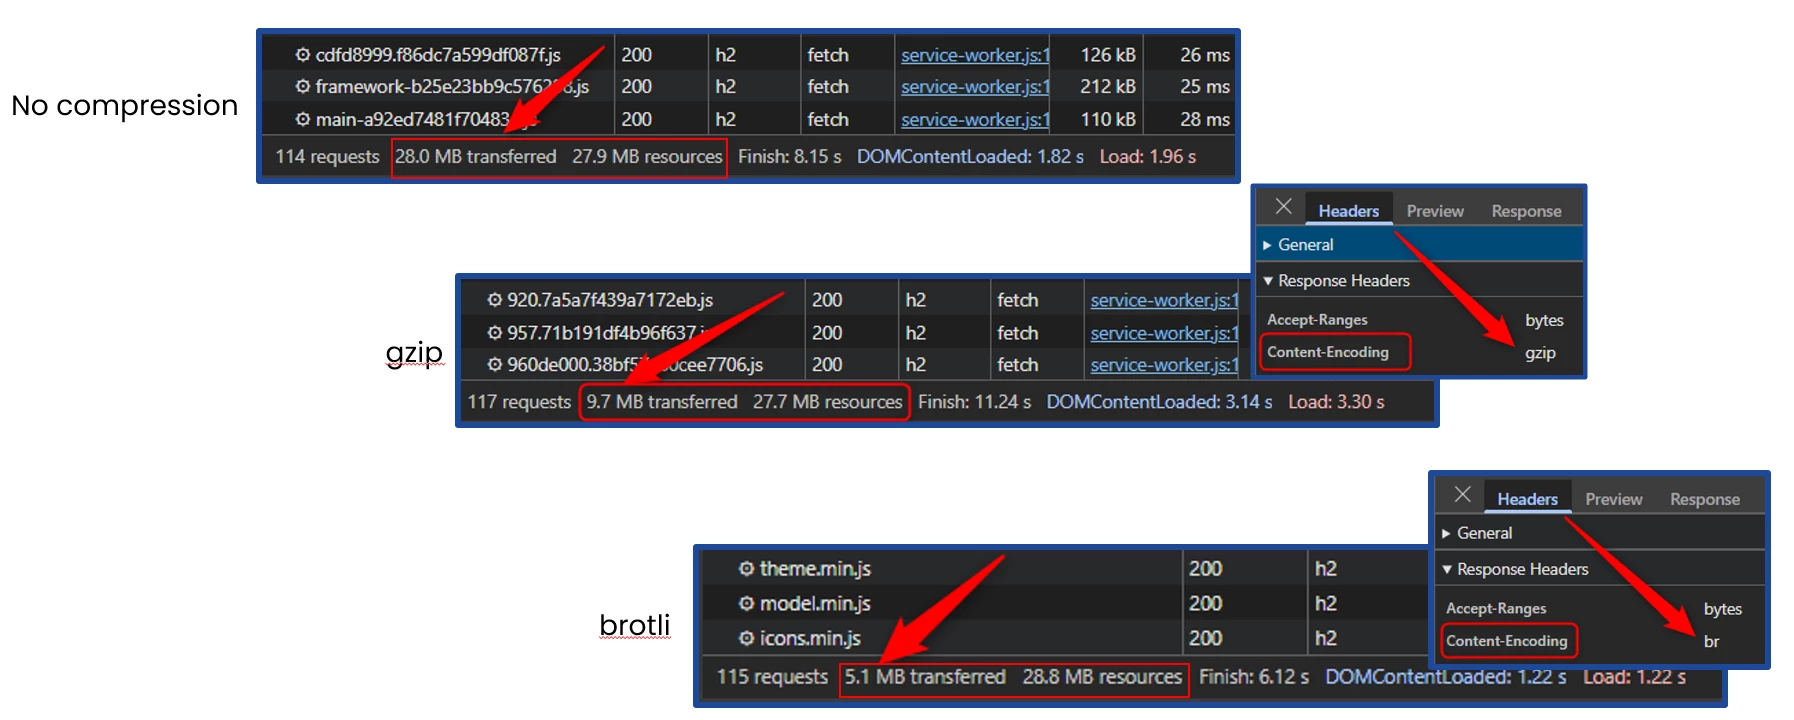
- Enable GZIP or Brotli compression. This compresses the data sent to and from your application and noticeably increases throughput. See IIS configuration in the Thinkwise documentation for turning on compression in IIS.
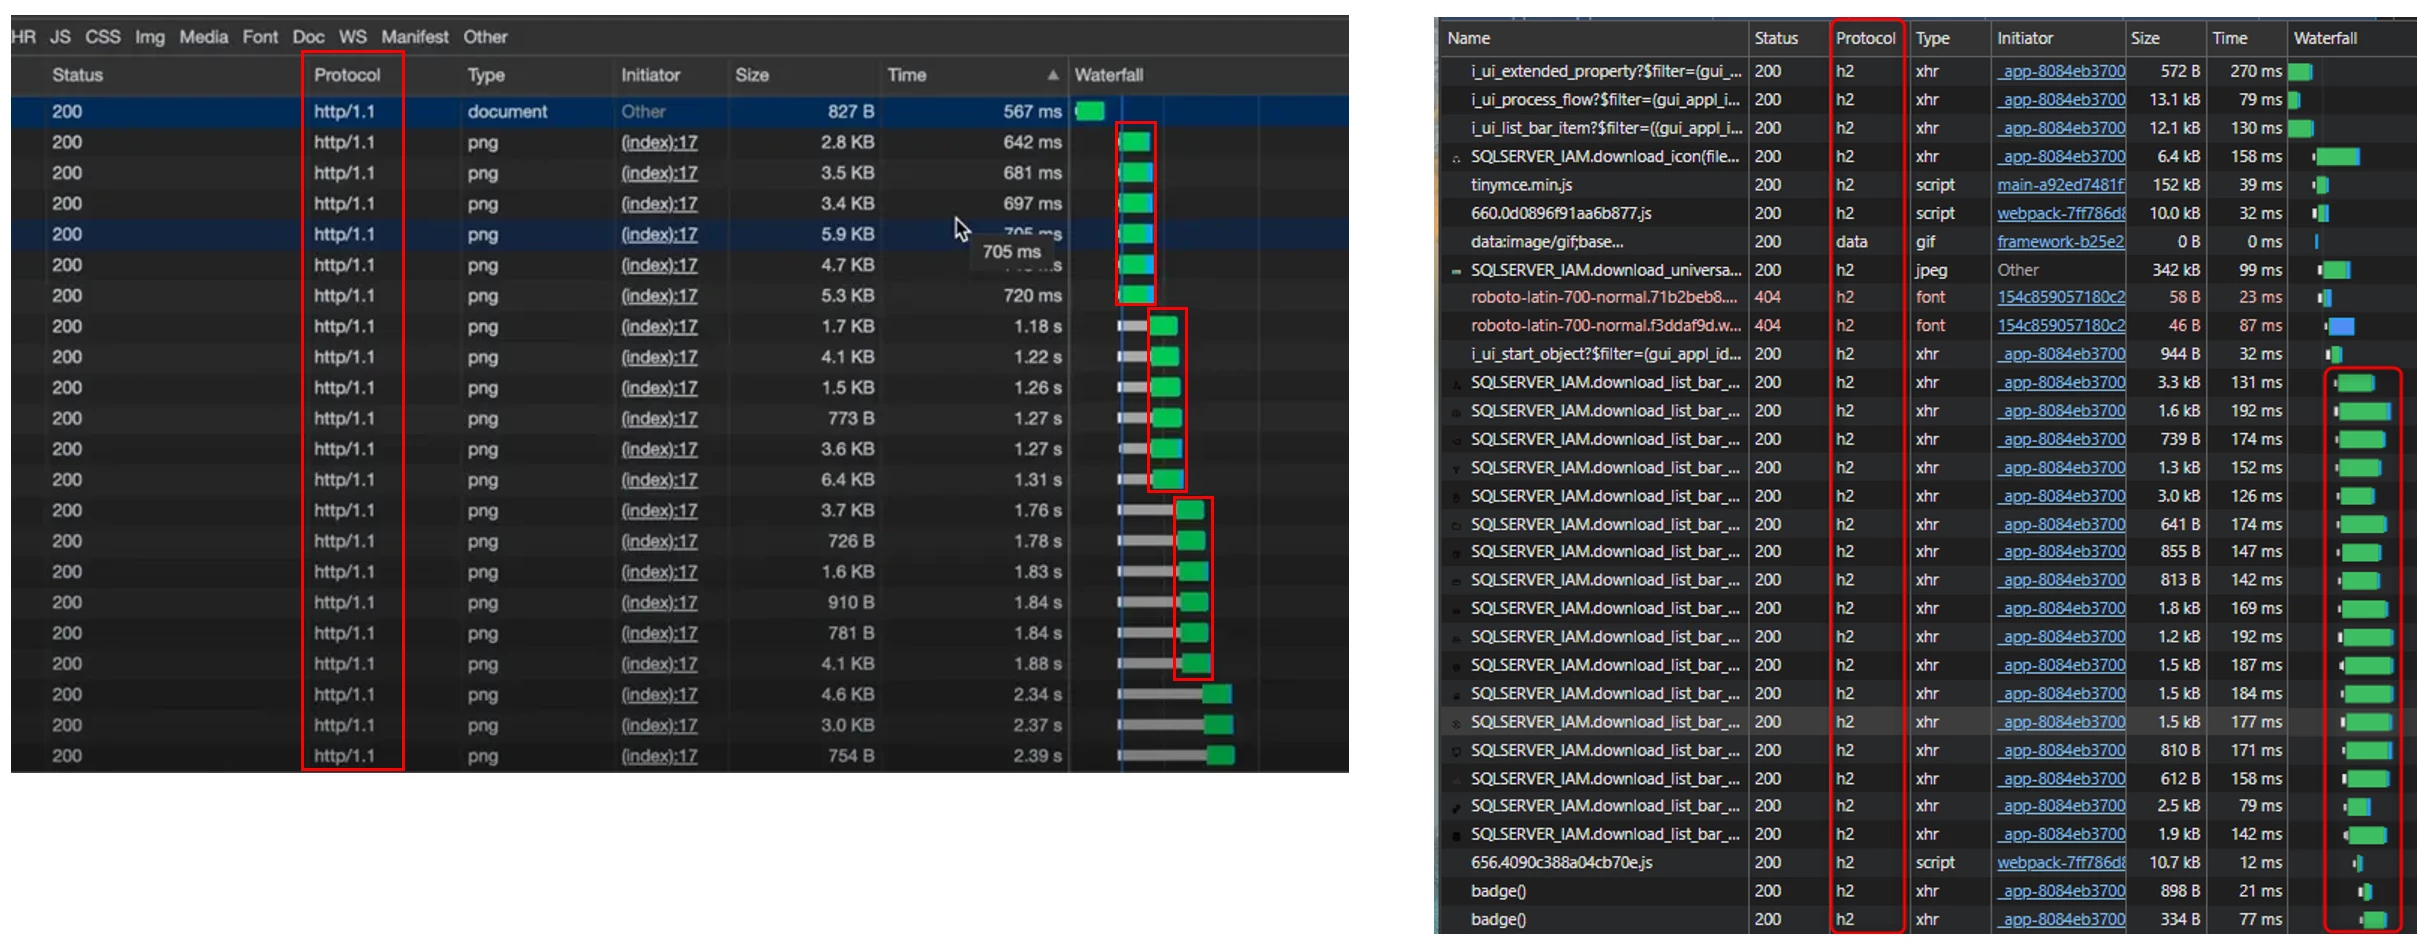
- Configure HTTP/2. It has lower latency and better efficiency than HTTP/1.1.
- Make sure the web server is properly reachable for your users, with firewall whitelisting where needed. See the reference architecture in the Thinkwise documentation for the network and firewall setup.
Test against a production-like environment
To judge whether something is really slow, you need somewhere realistic to measure it. Set up a performance-testing environment that matches production, both in database size and in infrastructure. This is why we recommend that your acceptance environment is essentially a duplicate of production.
The reason is simple: almost any query performs well against a small dataset. A screen that flies with a hundred test rows can crawl once a table holds hundreds of thousands. Test against production-sized data and you get an honest answer about how a query will behave for real users.
When everything feels slow, check the infrastructure
If every action you run is slow, the problem is probably not one query. That pattern points at the infrastructure underneath the application. Check that your environment is set up correctly and has enough resources for the load you expect. Our reference architecture documentation describes what a healthy setup looks like.
To tell whether a slow screen is the database's fault or the web server's, use Server Timing. Indicium returns Server-Timing metrics on most of its responses, so in your browser's developer tools you can open the slow request, go to the Timing tab, and see how much of the round trip was spent in the database versus in Indicium itself. One thing it will not show is the client: if the delay is in the browser rendering the screen, that does not surface here, so rule it out separately. See Indicium troubleshooting in the Thinkwise documentation for how to read these timings.
A blocked-up database also slows everything down over time. Indexes fragment as data changes, and fragmented indexes cost extra reads on every query. Rebuilding them regularly keeps that overhead from creeping in.
Tip. Schedule tsf_optimize() to run regularly on SF, IAM and Application databases. It rebuilds your indexes so fragmentation does not quietly slow the database down. See System flow schedules in the Thinkwise documentation to set the schedule.
If the whole database is slow and you have no idea where to start, reach for a diagnostic toolkit. Brent Ozar's free First Responder Kit is a well-known set of scripts that inspects a SQL Server instance and points you at the worst offenders: missing indexes, expensive queries, and configuration problems worth a closer look.
Understanding predicate pushdown
Predicate pushdown decides how fast almost every database query in your application runs. Take a Customer overview subject prefiltered on status = 'Active': if status is indexed, the database applies that filter at the base table and reads only active customers. Base that same prefilter on a query with a DISTINCT instead of a column condition, however, and pushdown breaks: the database has to build the entire deduplicated result set before it can apply the filter, so the query touches every customer regardless of how many are actually active. It is worth understanding this once, because the same rule also explains why a heavy expression field or a view behind a subject can quietly turn slow as the data grows.
When pushdown works, filtering a view costs proportionally less than reading all of it. When pushdown is blocked, filtering can cost nearly as much as selecting the entire view, because the engine has to process every row before it can discard the ones the filter excludes. The difference between a pushdown-friendly view and a blocking one is often a single line:
-- blocking: customer_id is not in the partition by
create view v_customer_rank as
select customer_id, region, order_total,
       rank() over (partition by region order by order_total desc) as region_rank
from orders;

select * from v_customer_rank where customer_id = 42;  -- scans everything first

-- pushdown-friendly: the filter column is in the partition by
select * from v_customer_rank where region = 'EU';     -- pushes down cleanly
This is exactly the trap in a view primary key built with ROW_NUMBER(). If the ID a user filters or joins on is not part of the PARTITION BY, every lookup by that key scans the full view first.
A handful of other SQL constructions block pushdown too, and which ones depend on your RDBMS, so verify on your own execution plan rather than assuming:
- DISTINCT always blocks: the engine has to build the full deduplicated set before any filter can apply on top of it.
- UNION blocks because it deduplicates. UNION ALL has no dedup step, so many optimizers can push a filter into each branch on its own.
- Aggregates: filtering a grouping column is safe, but filtering an aggregated value blocks, because the aggregate does not exist until the whole group has been processed. So a cube that lets users filter on a measure like total revenue over 1000 has to aggregate every group first, then discard the ones that fall short, on every drill-down.
- Outer joins: a filter on the preserved side pushes down, while a filter on the nullable side has to wait until after the join.
- CTEs usually inline like a subquery, but some engines materialize them (for example, DB2 for i), which blocks pushdown.
Not every slow view is a pushdown problem. Missing indexes on the base tables, non-sargable filters (wrapping a column in a function so the index cannot be used), and stale statistics all cause the same symptom: a view that is fast with a handful of test rows and unusably slow in production. Work from the outside in to tell them apart. Check the HTTP requests to see which call is actually slow, look at server-side timing to confirm the delay is in the database round trip and not the client, then pull the execution plan to see whether the filter is applied at the base table or only after the full view has been built. A blocked pushdown shows up there as a full scan on a table where you expected an index seek.
Start with the smoke tests
Before you spend a single minute tuning a view or rewriting a control procedure, run the smoke tests. They will catch several classes of issues that would surface as slow or broken screens in production, and give you a good idea of where to start.
Smoke tests check every SQL query your model generates and will warn you about a lot of issues: malformed queries, editable views that lack the RDBMS support to actually be edited, outdated parameterization, and stale dependencies between views, triggers, and stored procedures. Make sure to resolve all findings before you continue.
One signal is worth watching closely: a smoke test step that times out after 10 seconds. In the current release this raises a warning rather than an error, but it is worth watching these closely. In practice, an unusually slow smoke test is often the first hint that a view or procedure needs attention.

Fix slow subjects
Most subjects are backed by a table, and a well-modeled, properly indexed table is usually fast to begin with. A subject can also be backed by a view, and when one turns out to be slow, that view is often the reason. Either way the same fundamentals decide how fast the grid, the lookups, and the filters on top all feel: a sound primary key, indexed base tables, lean expression fields, and sensible prefilters. The Thinkwise performance guide in the documentation collects these fundamentals in one place.
Index the base tables
A subject is only as fast as the tables under it, and the biggest single lever there is indexing. SQL Server and the Software Factory indexes some things for you and leaves the rest to you, so it pays to know which columns almost always earn an index in a typical application database.
Primary keys are indexed automatically, as a clustered index by default. Indexes for foreign keys and default sort columns are automatically generated by the Software Factory.
Those automatic foreign-key indexes also cut down on locking and blocking during cascading deletes and updates on the parent table. Beyond the foreign keys, index the columns your queries lean on: the columns in join conditions, the selective columns in WHERE clauses that users (pre)filter on such as title, status, order number, or SKU.
When queries filter on several columns together, a composite index is often worth more than several single-column ones. Order matters: put the most selective, most commonly-filtered column first. The include checkbox when adding new index columns turns an index into a covering index, so a lookup never has to jump back to the table for a handful of extra columns.
Indexing is a trade-off, not a free win. Every index speeds up reads but slows down every insert, update, and delete, and it takes storage, so do not add one just in case. A bit column, or a column with two or three distinct values, rarely helps on its own unless it is a filtered index or a trailing column in a composite. And avoid a random GUID as a clustered primary key: new values insert in random positions and fragment the table, so prefer an int or bigint identity columns, or keep the GUID as a nonclustered key while something sequential clusters the table.
Over-indexing has a second, less obvious cost. Once a query gets complex enough, building the query plan itself can take real time, and the more indexes the optimizer has to weigh for the tables involved, the longer that step can take. Push it far enough and the plan-building can run into the optimizer's own timeout, so you get hit twice: a long wait just to get a plan, and a sub-optimal plan because the optimizer gave up early.
Do not guess at any of this. SQL Server keeps its own diagnostics: sys.dm_db_missing_index_details lists indexes the optimizer wished it had, and sys.dm_db_index_usage_stats shows which existing indexes are actually used and which only cost you writes. Add what the missing-index view suggests, drop what nothing reads, and measure against a production-sized dataset rather than a handful of test rows.
- Do: Index the join columns, and the selective columns your users (pre)filter, sort, and group by.
- Do: Prefer a composite index with the most selective column first over several overlapping single-column indexes.
- Do: Use sys.dm_db_missing_index_details and sys.dm_db_index_usage_stats to decide what indexes to add and which ones to drop.
- Don't: Add an index just in case; every index slows down writes and consumes storage.
- Don't: Use a random GUID as a clustered primary key; rows insert in random order and fragment the table.
Expression fields
An expression field is calculated during runtime, so its cost is paid for every row the user sees. That is fine for a light calculation, and it keeps the value up to date without storing anything extra. It stops being fine when the expression hides a heavy subquery or a lookup that runs once per row on a grid of thousands.
When an expression field turns up in a slow subject, ask what it really costs per row, and whether the value has to be live. If it does not change on every read, a stored column maintained by handler logic, or a calculated database column, moves the work out of the runtime. The Thinkwise performance guide compares these options and their trade-offs. The smoke tests also validate expression fields, so a broken or timing-out expression shows up there first.
- Do: Keep expression fields cheap; they run once per row on every selection.
- Do: Move a heavy or rarely-changing calculation to a stored column or a calculated database column.
- Don't: Hide a per-row subquery or lookup inside an expression field on a large grid.
- Don’t: Use expression fields in a view, those should be regular columns and part of the view itself.
Prefilters
A prefilter is one of the cheapest ways to make a slow screen fast. It limits how much data the database has to read and the UI has to render before the user does anything at all. Default a data-heavy subject to a sensible prefilter, for example only open orders from the last year, or only currently employed staff, so the screen opens with a workable set instead of the entire table.
It is tempting to show the user everything everywhere all at once, but that is rarely what they need. Most users work with current data and only reach for history now and then, and when they do, they can switch the prefilter off themselves. Default to what matters now, and you spare the database most of the work.
Keep the prefilters themselves fast too. Base them on indexed columns wherever you can, and prefer a plain column condition over a query when a column condition will do the job.
- Do: Default data-heavy subjects to a prefilter so the screen opens with a workable set, not the whole table.
- Do: Base prefilters on indexed columns and prefer a column condition over a query where possible.
- Don't: Open a subject on hundreds of thousands of rows with no default filter and count on pagination to save you.
Fix slow views
A view that backs a subject deserves the same discipline as a table, and that starts with the primary key. The smoke tests flag a view with no unique key, or a key that allows NULL values, but passing that check is only the first bar to clear.
The most reliable primary key for a view is one carried over from an underlying table, or a combination of the base tables' keys when the view spans several of them. Resist the urge to bolt on a random GUID just because nothing else looks unique. It satisfies the check, but it tells a reader nothing about the data, and it has no relation to any index that already exists on the base tables. If no combination of base-table keys is unique, that is usually a sign the view's grain is not what you expect, so fix the grain rather than papering over it with a GUID.
Calculating a key inside the view, for example with ROW_NUMBER(), is possible but carries a real cost. That window function is one of the constructions that can block predicate pushdown, covered under views and cubes below, so a key generated this way can force the database to number every row in the view before a filter on that key is even applied.
A few other habits pay off quickly. First, leave heavy views out of reference filtering when the filter is not essential, because filtering a large view can cost far more than filtering the table underneath it in your view’s control procedure. For example, if an Order subject has a lookup reference to a heavy Customer Statistics view, and the users adds a reference filter on this heavy view, it will slow down the query that loads the main subject because it now also has to check a filter condition against that heavy view. Prevent users from adding filters on heavy details by disabling the reference for filtering.
Second, index the base tables for the filters your users actually apply. Even a well-built view has to scan the whole table when there is no index to support the query.
Indicium also resolves a single row two different ways, and the two do not cost the same. A lookup or detail screen that reads a row by its key uses the entity's by-key segment (table(key)), which asks the database for exactly that one row and is essentially always fast. The same row fetched through a filtered query, such as $filter=id eq 42, runs the full view definition first and only then applies the filter, so it lives or dies by the same predicate pushdown rules covered above.
A view with a solid, indexed key resolves lookups through the by-key segment; a view whose key is calculated, for example with ROW_NUMBER(), or is otherwise not sargable, forces even a single-row lookup back into a full filtered query, so it ends up scanning the whole view to return one record.
- Do: Derive a view's primary key from the base table's key, or a composite of the base keys for a view that spans several tables.
- Do: Index the base-table columns your users actually hit: the join columns, the default sort, and the columns they filter on most, including the columns used in prefilters.
- Don't: Bolt on a random GUID as a primary key just to satisfy the uniqueness check.
- Don't: Calculate a primary key inside the view with ROW_NUMBER() or similar; it can block pushdown for every query that filters on that key.
- Don't: Use a query-driven lookup as a grid's presentation field when a (calculated) column from the base table would do.
Realtime view or a table with prepared data
It starts with a question about data volume: does the user really need to see everything at once? Making years of history available in every view is rarely necessary. Defaulting the range to the current period covers most use cases and cuts the work the database has to do on every open.
The advantage of a view is that it is always realtime. Sometimes, though, a view simply cannot be made to perform, because the calculation behind it is too heavy. In that case an option is to precompute the result and store it in a table instead of reading a realtime view. The table is refreshed on a schedule using a system flow, and you can give the user a task to force a refresh on demand.
A table with prepared data is faster, but the data is no longer realtime. Reach for it only when a view genuinely cannot be made to perform, and confirm that a slightly stale result is acceptable for that screen.
Cube performance in Universal
A Windows GUI cube loads the view's data once and does all grouping and aggregating on the client. That is heavy on memory and network for a large dataset, but it makes free-form re-pivoting fast because everything already sits in local memory. A Universal cube delegates grouping and aggregation to Indicium and the database, loading data on demand per subcategory as the user drills in.
There is a good reason for that split. A browser tab has far less memory headroom than a desktop process, it talks to the server in JSON rather than a lean binary protocol, and it often sits behind a corporate firewall that kills an idle HTTP request after about thirty seconds. Loading on demand, subcategory by subcategory, exists precisely so a cube over hundreds of thousands of rows does not fall over once several users open it at once.
How predicate pushdown affects the performance of cubes
Predicate pushdown can significantly affect the performance of your cube. The clearest way to show explain this is with an example: a cube drill-down. That is what happens when a user opens a category in a cube to see the level beneath it. A sales cube might start grouped by region; expand EU and you drill into its countries, expand Germany and you drill into its months. Every expand step asks the cube for a smaller, more specific slice of the data.
Predicate pushdown is what the database does with the filter that a drill-down implies. A predicate is simply a filter condition, such as region = 'EU'. Pushing it down means the optimizer applies that filter as early as possible, right at the base table scan, so the query reads only the rows it needs. When the filter cannot be pushed down, the database builds the entire view first and only then discards the rows the filter excludes.
In a cube the two meet on every click: each drill-down becomes a filtered, aggregated query, and predicate pushdown decides whether that query touches a narrow slice or scans everything before narrowing it down.
A Universal cube does not load a view once and pivot on the client the way the Windows GUI does. Every time a user expands a subcategory, Indicium sends a freshly filtered, aggregated query straight to the database. Whether that query is fast comes down almost entirely to predicate pushdown: the optimizer's ability to move a filter down to the base table scan instead of building the whole view first and throwing rows away afterward.
The practical consequence is that the pushdown-friendliness of the underlying view now decides how snappy every drill-down feels, not just the first load, because the Universal UI only ever asks the database for the slice it currently needs. Back a cube's dimensions and measures with columns that stay pushdown-safe. A dimension driven by a window function or a DISTINCT will be slow on every subcategory a user opens, not only the first. For example, a customer-segment dimension built with SELECT DISTINCT forces the database to rebuild the full deduplicated set every time, so each drill-down pays for the whole view again rather than just the slice on screen.
This is easy to overlook now that the Expand all button, added in 2026.1, opens every category and series in a single action. On a pushdown-friendly cube that is just a convenience. On a blocking one it fires every subcategory query at once, so a view that is merely sluggish per click becomes a full stall the moment a user expands the whole thing.
If a cube really struggles to perform and you are running out of options, consider using a table instead of a view as (part of) the foundation of the cube. This has the downside of no longer always showing real-time data, but will perform well.
- Do: Back cube dimensions and measures with pushdown-safe columns; every drill-down re-queries the database.
- Do: Default cubes to a limited range, such as the current period, instead of loading years of history.
- Do: Read the execution plan before assuming a slow cube is a pushdown problem; rule out missing indexes, non-sargable filters, and stale statistics first.
- Do: Use UNION ALL instead of UNION.
- Don't: Have a cube dimension with a window function or DISTINCT column; it will be slow on every subcategory.
- Don't: Filter on an aggregated column or a DISTINCT view and expect pushdown.
- Don't: Reach for a persisted, precomputed table as your first fix; treat it as a last resort.
Let AI be your performance buddy
AI is good at the part of performance work that wears a human down: reading a long execution plan and spotting where a filter lands too late. Give it the view definition and the query plan, and let it ask you questions and suggest changes. It will point at the full scan you skimmed past and ask why the filter on that column is not pushed down.
Keep the reins, though. An assistant does not know your data distribution, your indexes, or which screens actually matter, so treat every suggestion as a hypothesis to test against your own execution plan, not a fix to apply on faith. Paste the real SQL and the real plan rather than a description of them, and the answers get noticeably sharper.
Keep it fast, keep it a habit
Performance is not a one-time fix, it is a habit. Run the smoke tests every release and read the slow steps as early warnings. Monitor the Slow query log in your production IAM. Discover what code actually gets run by a trigger or procedure using the application log. Watch the execution plan when a cube starts to drag. Keep the logic concepts you do not need switched off. None of these moves is heroic, and together they keep an application fast as it grows.
Start by picking your slowest screen this week and walk it through this list, top to bottom. When you find the culprit, please also share it in the Thinkwise Community. Someone else is fighting the same issue in a slow query right now.