


Transport companies always have their eyes on the road—quite literally. With fleets spread across countries or even continents, it’s vital to know where every truck is and whether it has reached its destination. While GPS trackers are now standard in every vehicle, simply knowing it’s position isn’t always enough. That’s where geofencing comes in.
By assigning a digital boundary—known as a geofence—to each location, companies can automatically determine whether a vehicle has arrived or left. If it’s within the shape, it’s on site; if it’s outside, it’s not. Simple as that.
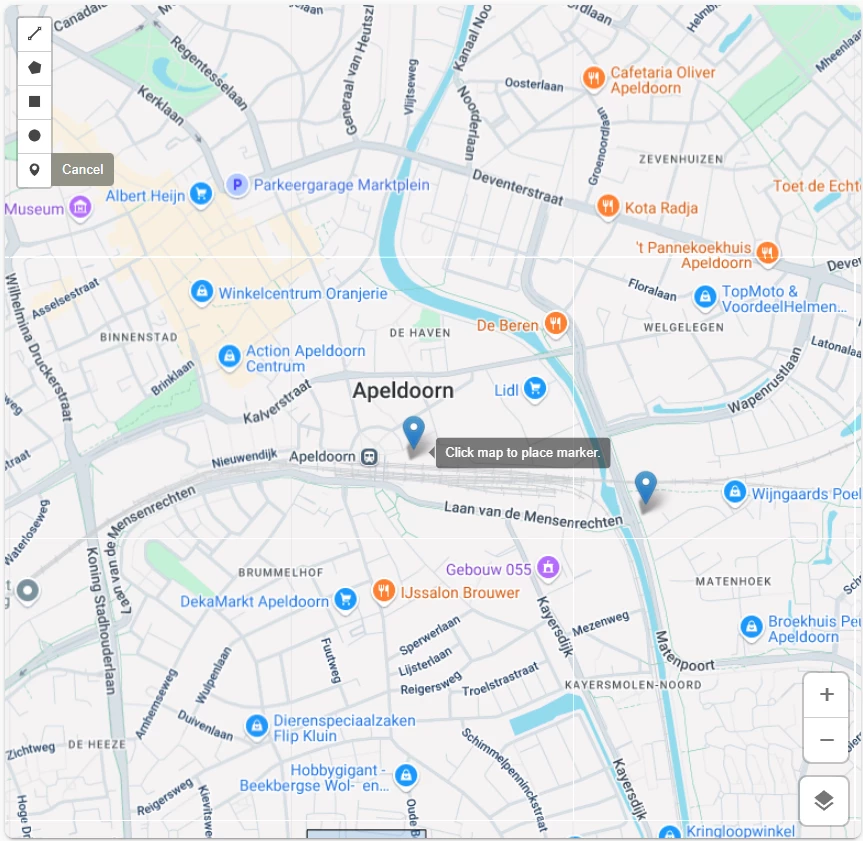
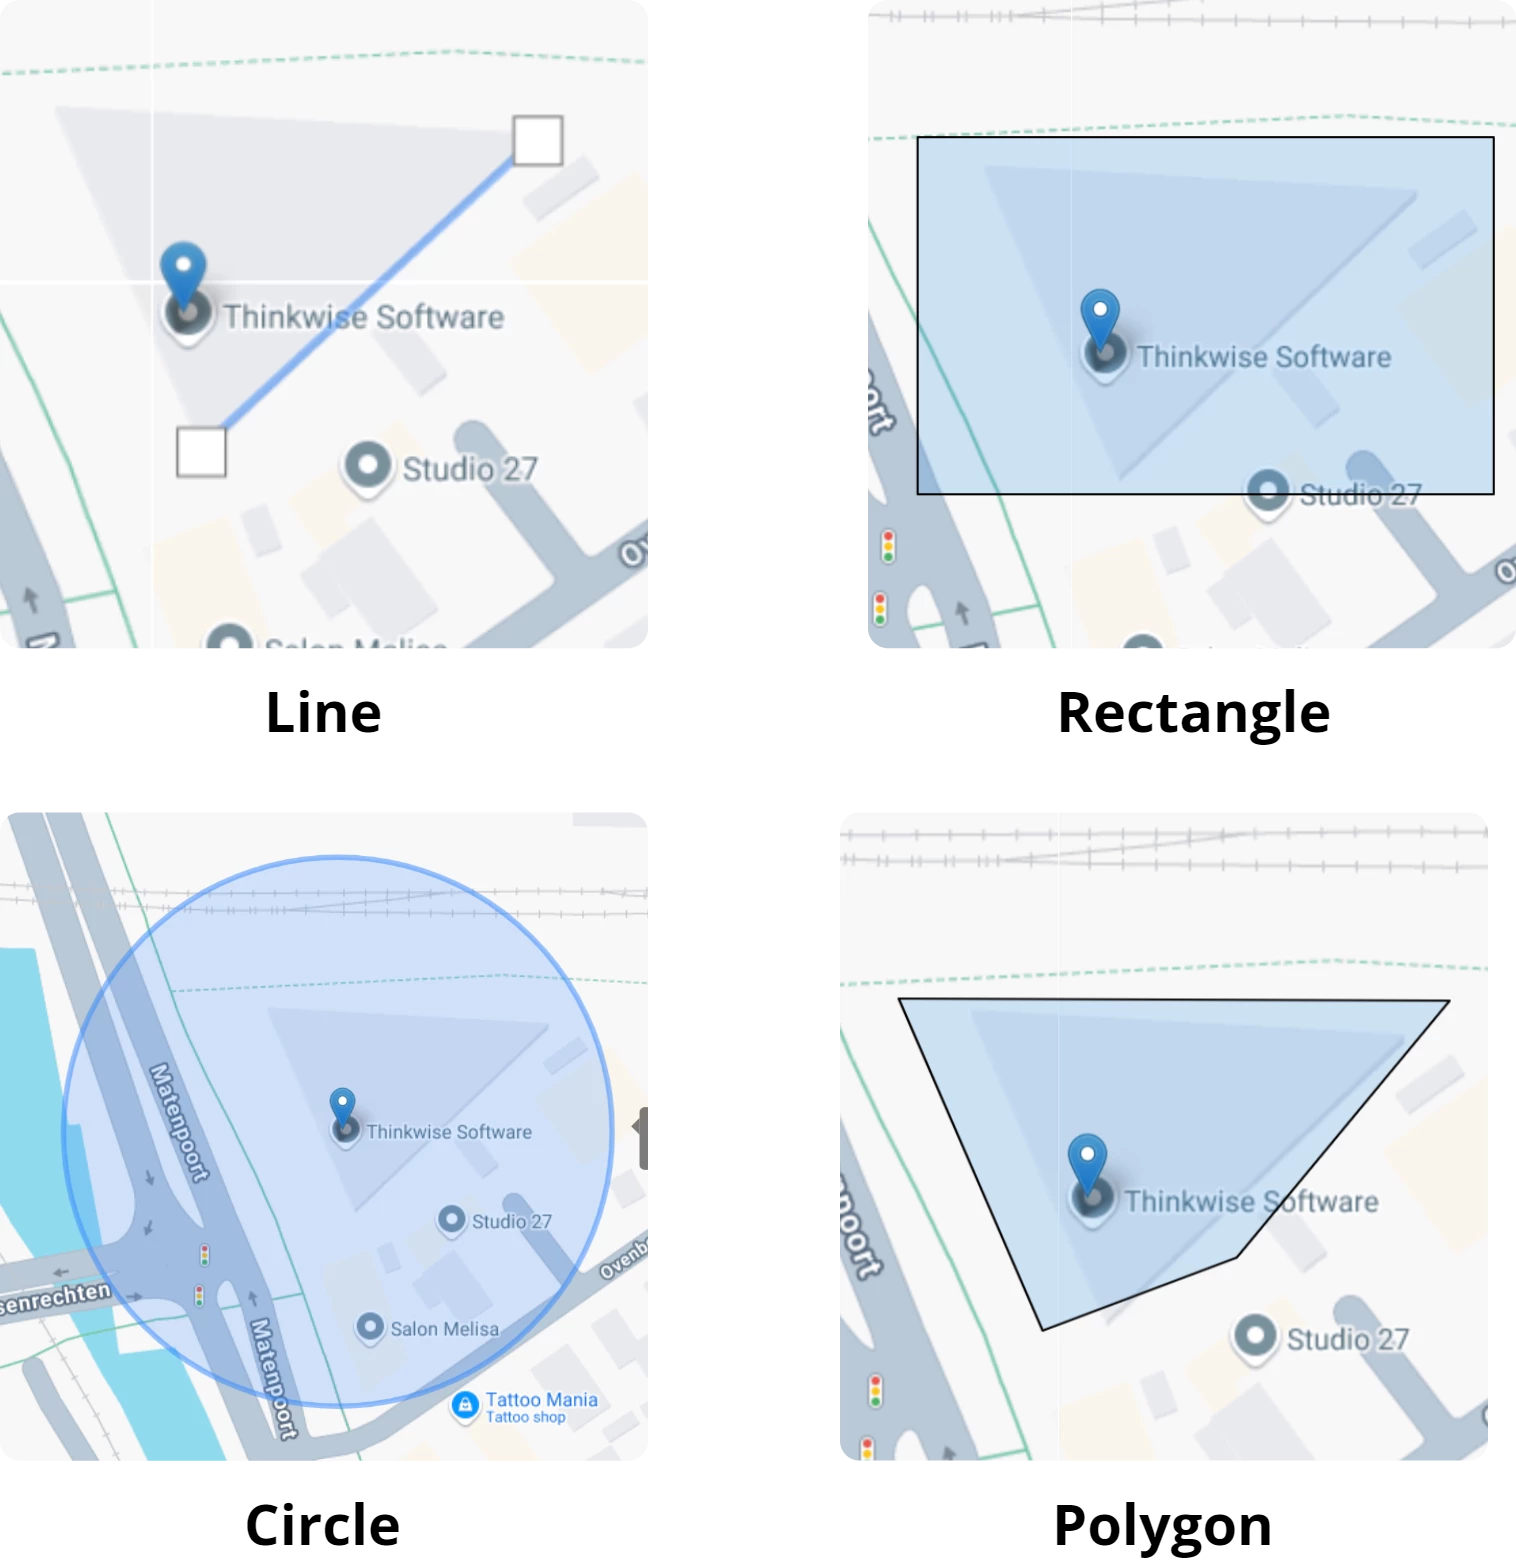
But managing all that location data can quickly become a challenge. That’s why the latest 2025.2 update to the Thinkwise Platform introduces a powerful, user-friendly way to work with maps. Users can now easily add markers, and draw circles, rectangles, lines, or complex polygons—directly within the application. It’s a major step forward in making geodata management faster, more intuitive, and integrated into your Thinkwise applications.
Configuration
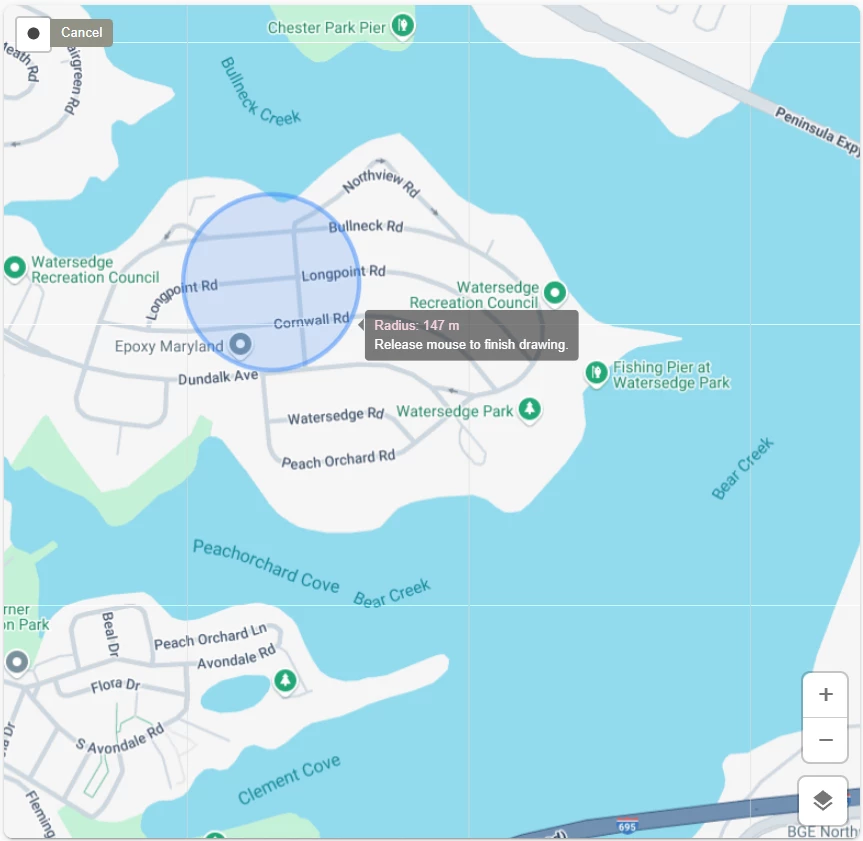
In this example, we’ll add the ability to draw a circle on the map. We’ll then store this geofence information in the ‘company_address’ table.
Because all drawing options follow the same principle, you can use this tutorial for any of them—just choose the desired marker or shape instead of a circle.
This guide consists of two steps:
- Setting up the task triggered when a shape is drawn on the map.
- Assigning this task in the Maps component.
We assume you already have a basic Maps component set up and will be adding drawing capabilities to it.
Maps component base setup
For more information about the basic setup of a maps component, see our documentation. If you’re looking for a practical example to get started immediately, download the “Maps and Routes” solution from the Thinkstore.
Creation task
Start by creating a new task to store the map data in your table: ‘add_company_address_geofence_circle’
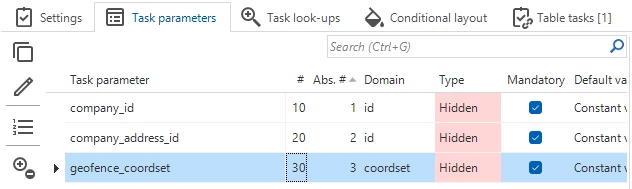
Add the table’s primary key columns and a coordinate set JSON parameter to the task. The primary key columns ensure the data is stored with the correct address, the ‘geofence_coordset’ field contains the geographic data in JSON format.
An example of a coordinate set JSON object:
{ "CoordSets": [ [ { "Lat": 52.20839876100734, "Lon": 5.97939399968484 } ] ], "Radius": 63.19832731146133 }
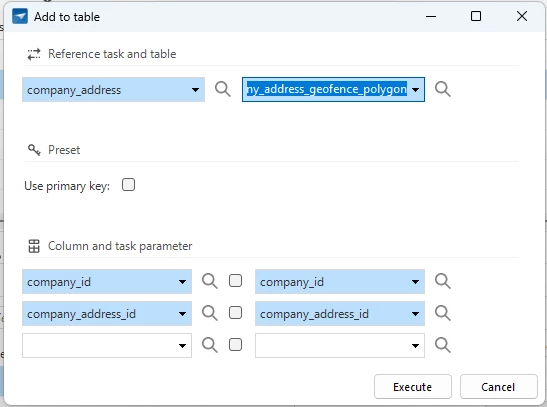
Assign the task as a table task to the table (or view) used by the Maps component. Assign the primary key fields as table task parameters. The ‘geofence_coordset’ parameter will be populated by the Maps component and does not need to be assigned as a table task parameter.
Control procedure
Create a new control procedure, write the code to store the geofence data, and assign it to the task. For our example we have the following code:
update company_address
set geofence_coordset = @geofence_coordset
   ,geofence_data_mapping_type = 3
where company_id = @company_id
and company_address_id = @company_address_id
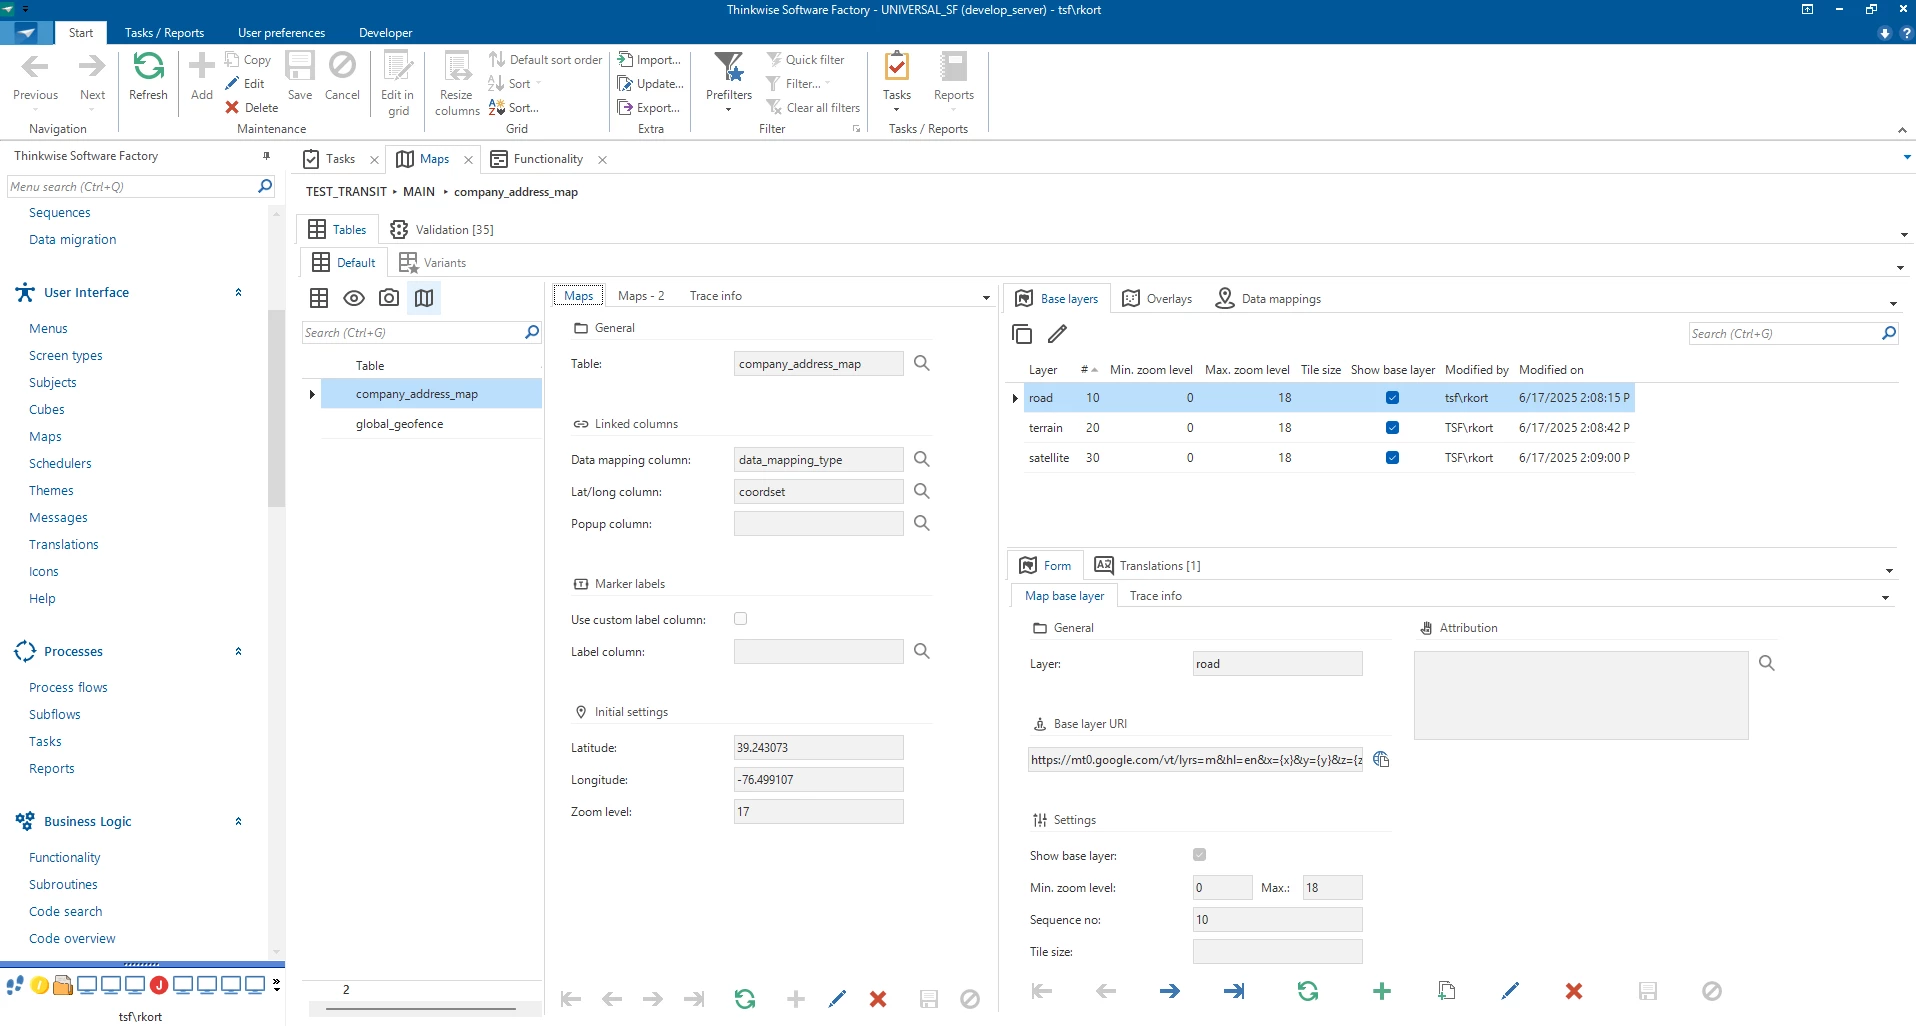
Maps configuration
Open the maps screen and select your map.
In the form, a new group has been added: ‘Geometric Type Creation’. Here, you can assign a task for each shape a user may draw. Assign the task you just created as the ‘circle creation task’. A second field, ‘Circle location parameter’, will appear. This is the parameter where the coordinates JSON object will be stored.
Select the ‘geofence_coordset’ parameter.
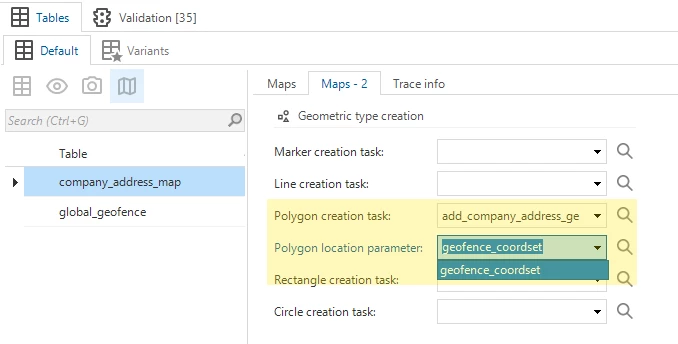
Note that for a task to appear in this list it needs to be assigned as a table task to the same subject as the Maps component.
After refreshing the model you should be able to draw a circle on the map.
If your shape seems to disappear after drawing, make sure you have the data mapping of the maps component setup properly, for more information see our documentation.
