Open

Set value of constant lines as column

Related products:Software FactoryUniversal GUI
Robert Jan de Nie
Jeroen van den Belt
Harm Horstman
Eric Franken
+28
  • Robert Jan de Nie
    Robert Jan de Nie
  • Jeroen van den Belt
    Jeroen van den Belt
  • Harm Horstman
    Harm Horstman
  • Eric Franken
    Eric Franken
  • Edwin Saan
  • Robbert van Tongeren
    Robbert van Tongeren
  • Michael
    Michael
  • Mark Jongeling
    Mark Jongeling
  • Renée Evertzen
    Renée Evertzen
  • Jeroen Kole
  • JordyBaas
  • Geurt
    Geurt
  • John Sangers
    John Sangers
  • eurban
    eurban
  • Gosia
    Gosia
  • Boudewijn
  • Erwin Ekkel
  • Freddy
    Freddy
  • Ricky
    Ricky
  • Remco Kort
    Remco Kort
  • Martin
  • mperrott
    mperrott
  • Marc Ferket
  • tiago
    tiago
  • rzwambag
  • Mark Leunissen
    Mark Leunissen
  • Bart Huizer
  • Marius Korff
    Marius Korff
  • Guido Bijl
    Guido Bijl
  • Tristan
  • BramG
  • Eric F
    Eric F
  • DavyvanderSchoot

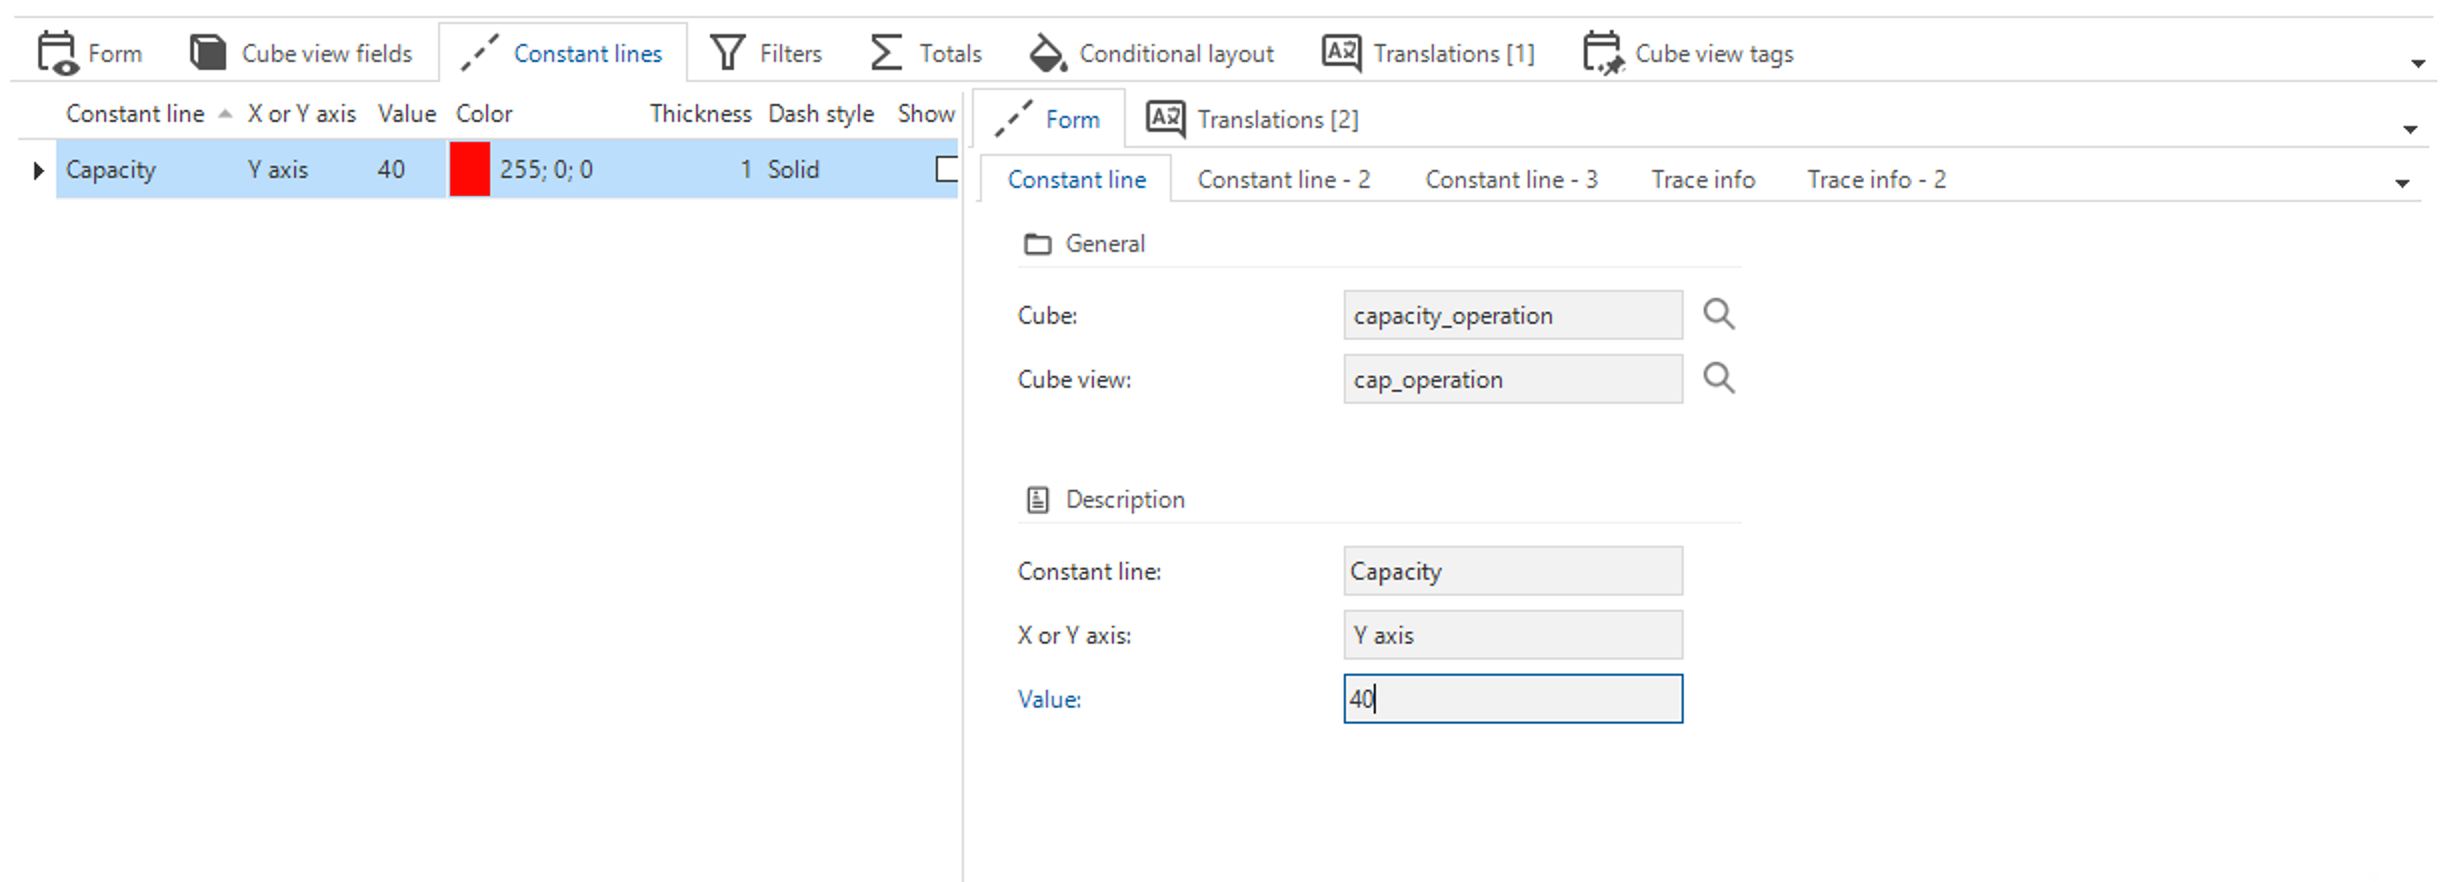
In the Business Intelligence module, we can show a constant line in the graph. The value of this constant line is determined in the Software Factory. It would be great if the value of the constant line can be set to a column in the end-application, so the end-user can decide on the value of the constant line. For example, we use the line to set the capacity of an operation. This value can change, and we do not want this to be the responsibility of the developers. 

It would be even better if this line can somehow be made dynamic. In the example of capacity, it would then show the capacity of the currently selected operation.


Did this topic help you find an answer to your question?

2 replies

Mark Jongeling
Administrator
Forum|alt.badge.img+23
NewOpen

Kevin Rosink
Forum|alt.badge.img+1

In addition to this idea, it would also be great if the value can be an expression like getdate() or a query to create conditional constant lines.

Also for the conditional layout of the cube views, the value is now limited to a hard user input in the model. Adding the expression possibility would create a lot more flexibility.

Right now it is only possible to apply the layout to the pivot grid, is it possible to extend tis ‘applied to’ checkboxes to the chart colors itself?

I am working with Universal.


Reply


Cookie policy

We use cookies to enhance and personalize your experience. If you accept you agree to our full cookie policy. Learn more about our cookies.

 
Cookie settings