Relationships between the items in a Workflow visualization component

Related products: Software Factory Universal GUI


In our Enterprise Service Management Application, the core of the system is the creation of workflows. At the moment it works quite nice creating new table roles and adding the type of connections between the activities. 

How ever, users are often request for mor visual aid in creating the workflow. 

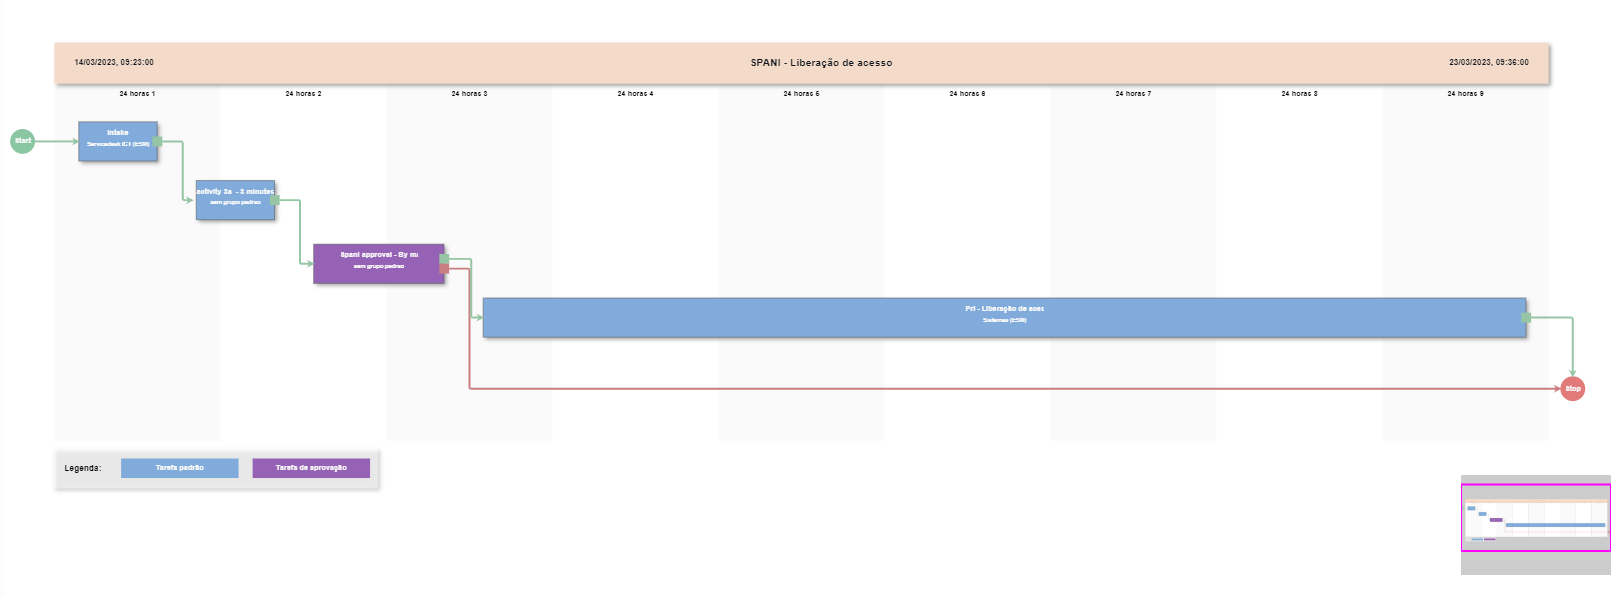
The visualization of the activities is already possible in the universal resource scheduler, however,  the links are not possible. 

Could this be added, like it exists in the windows and webGui since 2021??


Hi Tiago,

The Universal Resource scheduler has different functionality than the component available in the Windows and Web GUI. We have looked into your idea and decided that this will not become part of the Resource scheduler, but it would rather be a different component; for example a Workflow visualization component.

Would you mind if I rephrase the title to Relationships between the items in a Workflow visualization component


  • Hi Mark, that´s actually better :-) 

    As a one year user of the platform, I can affirm how powerful it is.  At the same time, as we are slowly moving into the space of a ISV, I see myself searching for components that make the software we create more user friendly with visualizations more on par with SaaS software. 

    I used a component of GOJS to create the visualization of our workflow, complete with: 
    - ability to create links between the nodes
    - define rules when a node can be created and when not
    - popup with extra information

    This might serve as inspiration ;-)


Awesome! Thank you for sharing 😄 Maybe this component could also be suitable as the Process flow designer in the future.


NewOpen


It is really powerful, and therefore a payed package :-)