Open

Pivot table on string

Related products:Universal GUI
  • July 31, 2025
  • 8 replies
  • 66 views

tiago
Captain
Forum|alt.badge.img+5

The pivot tables (Cubes) have come a long way and if I understand correctly, they are still under development. 

I have encountered some scenarios where I had the need for a more dynamic grid. In some scenarios we used views as a complicated work around, where the headers and amount of columns are fixed, and in the first row we create our own headers and we pivot the data in the query. Of course a sub optimal solution. 

In other scenarios we used the grid + grouping as an alternative, so data is shown close to each other

As a practical example:
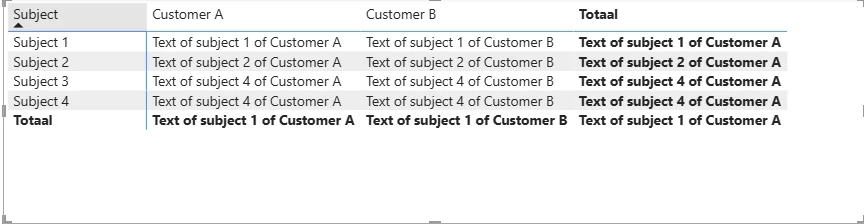
In a proof of concept, a customer wants to compare the texts of different contracts per subject and per supplier.

The ideal situation would be to have the suppliers on one axis and the subject on the other
the specific text of each subject / supplier would be visible in a cell.

In a pivot table in Excel and in Power BI it is perfectly possible to use a string for the data. It simple demonstrates the text or counts the amount of entries. 
I noticed that the cube of Thinkwise can only handle numeric fields. 


If the cube could handle strings as well this could be very valuable to create matrixes like the one I mentioned.

Do you think this is technically viable? Or do you see other possibilities that I'm missing? 

8 replies

Forum|alt.badge.img+2

Hi Tiago,

I’m not sure what you mean by saying that you use a string in an Excel Pivot. When you pick a string as the value, the only thing it can do is count them. And that you can also do with our Pivot. A pivot is primarily a summarization tool. 

We have added the concept of editing, when this summary has just 1 row as its source, but that does not mean that it would be easy to substitute that for an actual string, because all the queries and requests that fetch the values expect some kind of summary/aggregation, and thus a numeric value.

It would have to be some kind of ‘special’ control that would count the unique strings, thus be a numeric value, but know how to fetch and display the string and allow that to be edited instead of a numeric value. And it would probably be nice if it still performed. 

I don’t think this is impossible, because the domain with elements does something similar, although there the amount of possible strings is limited to the elements, but it would require a lot of changes. Also, to the SF, because the pivot component would need to know when you want to do this. 

Not impossible, but also not trivial.


tiago
Captain
Forum|alt.badge.img+5
  • Author
  • Captain
  • August 1, 2025


"The ideal situation would be to have the suppliers on one axis and the subject on the other
the specific text of each subject / supplier would be visible in a cell."

=> I was asking to have the actual text visible, not the count. 

Maybe I'm mistaking of this being possible in Excel. I believe it is possible with powerBI. Let me see if I can make an example. 


But maybe think about the question behind the question: 

Views and stables are rigid in amount of columns. Sometimes you want to pivot information, also text, which with text is not possible at the moment.

The link of using the the cube to pivot is of course quite easily made, but maybe there are alternatives. 


Mark Jongeling
Administrator
Forum|alt.badge.img+23
NewUnder review

Mark Jongeling
Administrator
Forum|alt.badge.img+23

Hey Tiago,

An example would be great to add for understanding your idea better. Looking forward to it!


Forum|alt.badge.img+2

I’m sorry if I left the impression that I didn't understand why you would want this. My brain was already trying to solve this technically;

Given this example, can you confirm/deny that this expresses the idea?

We have a course with students and for every week we would like to express a free text progress description.

That would give us data like;

Student Week Opinion
Jake 1 Starts of strong
Jake 2 Laking behind 
Jake 3 Completely lost interest
Mary 1 Very interested
Mary 2 Progress is strong
Mary 3 Completely gets it


Whenever you add a student or a week, the table will grow. And it is not grouped very intuitively. With you’re suggestion (however we would choose to solve it), you could define this UI.

  Week    
Student 1 2 3
Jake Starts of strong Laking behind  Completely lost interest
Mary Very interested Progress is strong Completely gets it
Paul      
Harry      


This focuses you more on providing the remark per student.

Is this a correct representation of what you are asking?


tiago
Captain
Forum|alt.badge.img+5
  • Author
  • Captain
  • August 5, 2025

Hi ​@Sebastiaan Meijerink,

That is exactly what I mean. 

In my example it would be like this ​@Mark Jongeling :


I've read somewhere that in western culture, people are used to focused from in a Z direction: Left top top right top, to left bottom to right bottom. 
That is whywe find it easier to do comparisons from left to right in stead of from top to bottom. In terms of UX this would be quite beneficial. 

In tecnical terms it would make it possible to be flexible in terms of creating "tables” with dynamic amount of columns. 


  • Rookie
  • August 8, 2025

This could be a very useful addition. We could really use it to compare product specifications, for example.


Jeroen van den Belt
Administrator
Forum|alt.badge.img+10
Under reviewOpen