

Closed

Make a pivotgrid scrollable

Related products:Software FactoryWindows GUIUniversal UI
  • March 16, 2023
  • 11 replies
  • 185 views

Forum|alt.badge.img+14

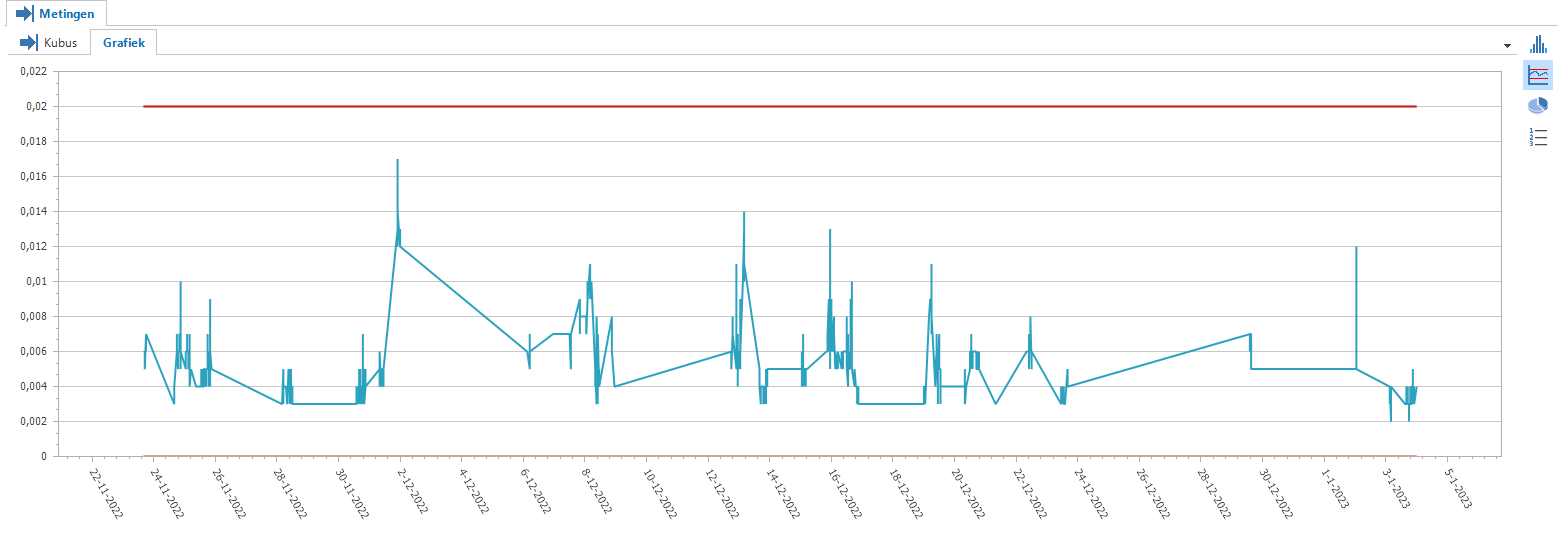
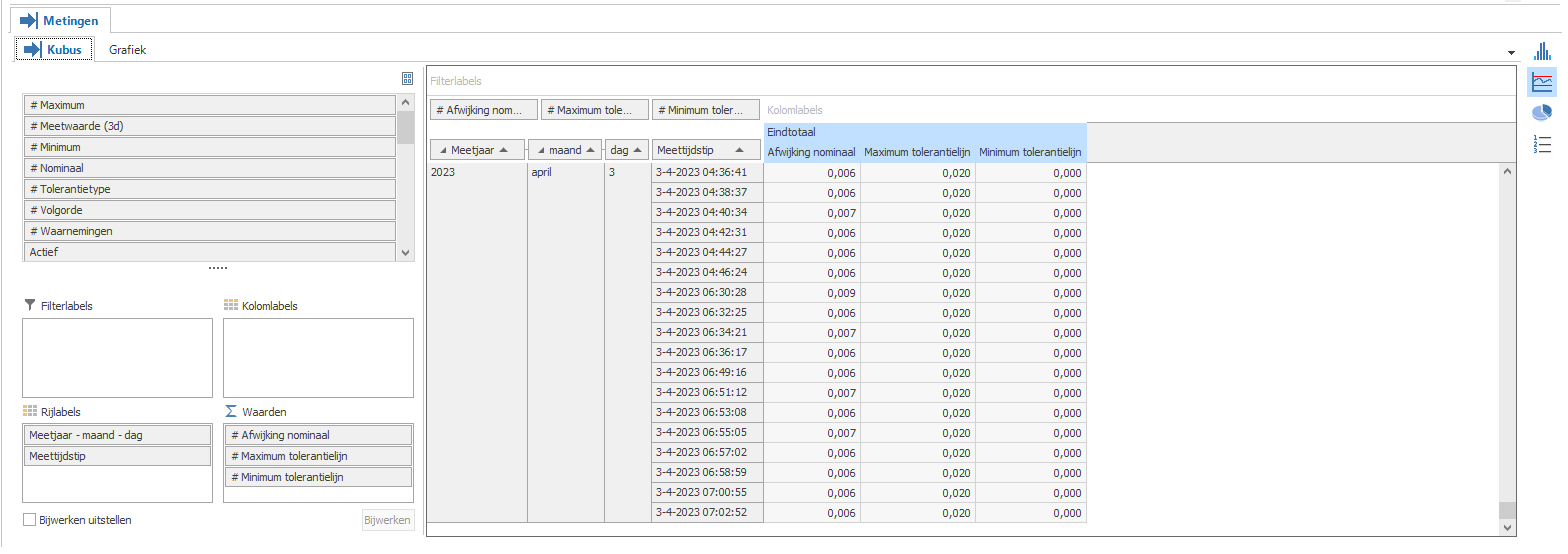
We have a 2dline chart (see below) that shows values in time. The chart shows a subset of the values in the pivot table (around 1000 rows?). 

Is this a known limit? Is there a way to scroll in time?    
 

11 replies

Jasper
Thinkwiser
  • March 31, 2023

Hi Andre,

Have you perhaps set the maximum number of records for the subject?


Forum|alt.badge.img+14
  • Author
  • Captain
  • March 31, 2023

Hi @Jasper,

The max_no_of_records is null for table and variants. 


Jasper
Thinkwiser
  • March 31, 2023

Can you share the query from the debug screen that is used to fetch the data for the chart?


Forum|alt.badge.img+14
  • Author
  • Captain
  • April 3, 2023

This is the query from the debug screen. 

select t1.[measurement_id], t1.[measurement_parameter_product_id], t1.[measurement_parameter_product_instance_id], t1.[type_of_measurement_id], t1.[production_order], t1.[product], t1.[product_type], t1.[product_type_sub], t1.[serial_number], t1.[measuring_device], t1.[type_of_measurement], t1.[measurement_date_time], t1.[production_order_no], t1.[product_code], t1.[measured_parameter], t1.[minimum_value], t1.[maximum_value], t1.[nominal_value], t1.[measured_value_numeric], t1.[nominal_deviation], t1.[minimum_tolerance], t1.[maximum_tolerance], t1.[type_of_tolerance], t1.[nominal_deviation_alfanumeric], t1.[nominal_deviation_alfanumeric_2d], t1.[device_no], t1.[active_ind], t1.[sequence_number], t1.[measurement_sequence_number], t1.[last_measurement_ind]
from [vw_measurement_cube] as t1
where (t1.[measurement_parameter_product_id] = 472)
  and (t1.[last_measurement_ind] = 1 and t1.[active_ind] = 1)
  and ((t1.measurement_date_time > dateadd(week, -coalesce(dbo.get_session_process_stream_value('measurement', 'number_of_weeks'), 26), getdate())
) )

The number of weeks is an session variable that can be changed using a task. 

The chart is showing dates from 22-11-2022 to 5-1-2023. First date is 23-11-2022. 

The cube contains dates from 23-11-2022 to 3-4-2023

It is a lot of detail information to show (measurements in time), but I would expect to have the possibility to show all values (scroll?).    


Jasper
Thinkwiser
  • April 7, 2023

Hi Andre, 

Indeed, there seems to be a maximum of 1000 visible data points.
I have created a ticket to investigate this, including the possibility to scroll horizontally: 6610S


Forum|alt.badge.img+2
  • Moderator
  • April 26, 2023

Hello André,

In our next windows gui, the 1000 max visible data points limit has been removed. It is now unlimited.
This release is scheduled at the second of May. 


Forum|alt.badge.img+14
  • Author
  • Captain
  • April 26, 2023

That's nice Edo!

Will it also be scrollable?


Forum|alt.badge.img+2
  • Moderator
  • May 2, 2023

Hello André,

Unfortunately no, Making the max visiable datasource unlimited was quite easy, however making it scrollable isn't. 
Also we see a scrollable pivotgrid more as a wish, so i will try to change this question to a wish.


Mark Jongeling
Administrator
Forum|alt.badge.img+23
NewOpen

Jeroen van den Belt
Administrator
Forum|alt.badge.img+10

Unfortunately, this idea has not received enough votes. Because we want to keep the focus on ideas that are in high demand in our Community, we are closing this idea.


Jeroen van den Belt
Administrator
Forum|alt.badge.img+10
OpenClosed