When you open the Universal GUI for the first time, or after an update I assume the full model is loaded, this can take up to a few seconds where you are staring at a white screen with not visual indication that there is actually something happening. This is quite unwanted, especially in situations where connections are slower.
I would like to see a visual indication (like windows) showing that something is happening.
Did this topic help you find an answer to your question?
I´ve created a small movie of a case in our tool, where we pick-up a task and than some calculations are performed.
It takes quite a while (even after optimizing the calculations) and the time it takes is usually acceptable, but without visual indication you start doubting if something is actually going to happen: https://share.vidyard.com/watch/KLWLcgr8xfpa5HRaA1yL14?
It would be nice to be able to start a visual indicator and end an indicator at the end of the whole process.
The subsequent calculations after the task appeared to be finished, are they part of a process flow?
The 2023.1.14 release of the Universal GUI has introduced the a process flow progress indicator which will show a progress indicator in the title bar when a process flow is running.
The subsequent calculations after the task appeared to be finished, are they part of a process flow?
The 2023.1.14 release of the Universal GUI has introduced the a process flow progress indicator which will show a progress indicator in the title bar when a process flow is running.
We tend adopt quickly new releases and at the moment we are on the latest versions of Indicium and U-GUI. We do not use a lot of flows as I don't find them very performant, especially when they quite some nodes to go through.
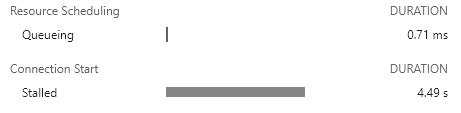
What I've noticed a lot, is a delayed start. I haven't quite figured out where it actually is coming from but we suffer a lot from stalled starts. I can only pinpoint at the moment that our former host and current host is not the most responsive.
Because most elements are loaded separately and in sequence some unwanted things are happening. However it starts with a bit more visual support to see what is still loading. the U-Gui has a loading icon in the beginning, I guess its connected to the model?
I would for example like to see, what you see in some other products where the various screen-blocks are grouped and tied to loading indicator. In terms of the TW platform this would mean .. have a visual indicator tied to screen-elements indicating that a main-grid (incl. def/lay/ctx) is still loading for example.And to a form (they are the slowest to load in my experience).. and to a detail.. et cetera.
If the connection is optimal, you don't really miss this visual support.. but in cases where this is not case,, it's a big missing feature for me.
In these situations I can definitely see how a loading indicator or ‘skeletons’ while loading would be ideal.
I can’t be certain regarding the problem tiago described if this has to do with model loading. The task is finished as indicated by the loader pop-up closing, but the new document is not yet opening. I’m not sure what is happening ‘in between’.
Be sure to always use http/2 to prevent stalling connections. If the problem persists, it could be an issue in the underlying TCP connecions - check chrome://net-export to trace this. Upload to https://netlog-viewer.appspot.com/, go to HTTP/2 and click the ID of the session.
I've just made sure that http2 is always forced on the webserver, so let's see how that plays out. Thanks for the tip.
The other part is the server-response time. This one seems a bit high always and I cannot lead it back to for example a non-performant query. I do no that the average ‘ping’ here is relatively high, which can, if I understand everything correctly, be one of the causes it more often feels a bit lagged.
Especially when I emulate a 3G connection, I get the same experience. So it would be something I would like to see some support for. Especially when it comes to delayed application of DEF/LAY/CTX procedures, because they are often used to forbid certain actions.
@Arie V do you have similar experiences with running Indicium on your vessels?
@Freddy The ‘lagginess’ of the Universal GUI you describe is also very prevalent to us as well (not only on our Vessels). With the risk of getting to far astray from the Idea originally posted here, there are a few things that come to mind related to this topic:
With regards to the comment by @Erik Brink in this topic on Context procedures: we have indeed TCP 6859S open. I really think it is a very big risk that we can start a Task while the Context is not yet loaded, and believe that the GUI should be much more restrictive/prescriptive than it is. I would say that logic like Layout and Context needs to be finished before a user is allowed to do the next action on the same record. But we've had this same discussion with also @Anne Buit on Process Flows. Back then we kinda disagreed: I want to have stuff like the Context procedure and Process Flows water tight, to prevent by all means possible that users do things they are not supposed to do, but Thinkwise was more lenient to the idea of Process Flows ‘guiding’ the user, rather than ‘forcing’ them.
In response of some questions on High latency / low bandwidth optimizations @Vincent Doppenberg pointed out that the use of Brotli compression might really help: High latency / low bandwidth optimizations Universal GUI | Thinkwise Community (thinkwisesoftware.com). It turned out that we weren't properly using compression at all, so Brotli reduced the download size of the resources by about 90%. This is especially prevalent on the first loading of the Universal GUI and makes a huge difference especially on the Vessels:
By the way: in preparation to these responses I did test with (re)loading the Universal GUI before and after login, and noticed that a spinning bar does show once in a while both before and after login in Universal GUI 2023.2.10, although it is not constantly/consistently shown. I do see room for improvement there too (as suggested with this Idea).
When you open the Universal GUI for the first time, or after an update I assume the full model is loaded, this can take up to a few seconds where you are staring at a white screen with not visual indication that there is actually something happening. This is quite unwanted, especially in situations where connections are slower.
I would like to see a visual indication (like windows) showing that something is happening.
Page 1 / 1
New→Open
Yes please! More often then not I am under the impression the gui is not functioning/doing anything. Only to find out it was actually loading.
I´ve created a small movie of a case in our tool, where we pick-up a task and than some calculations are performed.
It takes quite a while (even after optimizing the calculations) and the time it takes is usually acceptable, but without visual indication you start doubting if something is actually going to happen: https://share.vidyard.com/watch/KLWLcgr8xfpa5HRaA1yL14?
It would be nice to be able to start a visual indicator and end an indicator at the end of the whole process.
Hi tiago,
The subsequent calculations after the task appeared to be finished, are they part of a process flow?
The 2023.1.14 release of the Universal GUI has introduced the a process flow progress indicator which will show a progress indicator in the title bar when a process flow is running.
We used to use process flows, but the performance of this solution was insufficient to our need.
@Freddy , could you please explain what happened when we used the process flow and what we technically use now?
Anne Buitwrote:
Hi tiago,
The subsequent calculations after the task appeared to be finished, are they part of a process flow?
The 2023.1.14 release of the Universal GUI has introduced the a process flow progress indicator which will show a progress indicator in the title bar when a process flow is running.
We tend adopt quickly new releases and at the moment we are on the latest versions of Indicium and U-GUI. We do not use a lot of flows as I don't find them very performant, especially when they quite some nodes to go through.
What I've noticed a lot, is a delayed start. I haven't quite figured out where it actually is coming from but we suffer a lot from stalled starts. I can only pinpoint at the moment that our former host and current host is not the most responsive.
Because most elements are loaded separately and in sequence some unwanted things are happening. However it starts with a bit more visual support to see what is still loading. the U-Gui has a loading icon in the beginning, I guess its connected to the model?
I would for example like to see, what you see in some other products where the various screen-blocks are grouped and tied to loading indicator. In terms of the TW platform this would mean .. have a visual indicator tied to screen-elements indicating that a main-grid (incl. def/lay/ctx) is still loading for example.And to a form (they are the slowest to load in my experience).. and to a detail.. et cetera.
If the connection is optimal, you don't really miss this visual support.. but in cases where this is not case,, it's a big missing feature for me.
In these situations I can definitely see how a loading indicator or ‘skeletons’ while loading would be ideal.
I can’t be certain regarding the problem tiago described if this has to do with model loading. The task is finished as indicated by the loader pop-up closing, but the new document is not yet opening. I’m not sure what is happening ‘in between’.
Be sure to always use http/2 to prevent stalling connections. If the problem persists, it could be an issue in the underlying TCP connecions - check chrome://net-export to trace this. Upload to https://netlog-viewer.appspot.com/, go to HTTP/2 and click the ID of the session.
Anne Buitwrote:
In these situations I can definitely see how a loading indicator or ‘skeletons’ while loading would be ideal.
I can’t be certain regarding the problem tiago described if this has to do with model loading. The task is finished as indicated by the loader pop-up closing, but the new document is not yet opening. I’m not sure what is happening ‘in between’.
Be sure to always use http/2 to prevent stalling connections. If the problem persists, it could be an issue in the underlying TCP connecions - check chrome://net-export to trace this. Upload to https://netlog-viewer.appspot.com/, go to HTTP/2 and click the ID of the session.
I've just made sure that http2 is always forced on the webserver, so let's see how that plays out. Thanks for the tip.
The other part is the server-response time. This one seems a bit high always and I cannot lead it back to for example a non-performant query. I do no that the average ‘ping’ here is relatively high, which can, if I understand everything correctly, be one of the causes it more often feels a bit lagged.
Especially when I emulate a 3G connection, I get the same experience. So it would be something I would like to see some support for. Especially when it comes to delayed application of DEF/LAY/CTX procedures, because they are often used to forbid certain actions.
@Arie V do you have similar experiences with running Indicium on your vessels?
@Freddy The ‘lagginess’ of the Universal GUI you describe is also very prevalent to us as well (not only on our Vessels). With the risk of getting to far astray from the Idea originally posted here, there are a few things that come to mind related to this topic:
With regards to the comment by @Erik Brink in this topic on Context procedures: we have indeed TCP 6859S open. I really think it is a very big risk that we can start a Task while the Context is not yet loaded, and believe that the GUI should be much more restrictive/prescriptive than it is. I would say that logic like Layout and Context needs to be finished before a user is allowed to do the next action on the same record. But we've had this same discussion with also @Anne Buit on Process Flows. Back then we kinda disagreed: I want to have stuff like the Context procedure and Process Flows water tight, to prevent by all means possible that users do things they are not supposed to do, but Thinkwise was more lenient to the idea of Process Flows ‘guiding’ the user, rather than ‘forcing’ them.
In response of some questions on High latency / low bandwidth optimizations @Vincent Doppenberg pointed out that the use of Brotli compression might really help: High latency / low bandwidth optimizations Universal GUI | Thinkwise Community (thinkwisesoftware.com). It turned out that we weren't properly using compression at all, so Brotli reduced the download size of the resources by about 90%. This is especially prevalent on the first loading of the Universal GUI and makes a huge difference especially on the Vessels:
By the way: in preparation to these responses I did test with (re)loading the Universal GUI before and after login, and noticed that a spinning bar does show once in a while both before and after login in Universal GUI 2023.2.10, although it is not constantly/consistently shown. I do see room for improvement there too (as suggested with this Idea).
We use 3 different kinds of cookies. You can choose which cookies you want to accept. We need basic cookies to make this site work, therefore these are the minimum you can select. Learn more about our cookies.