Solved

Debugging Universal GUI

  • 8 July 2021
  • 4 replies
  • 191 views

Userlevel 4
Badge +11

Cautiously we started our exploration of the Universal GUI :spy_tone3:  

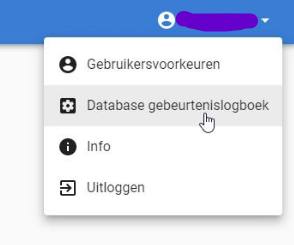
Something I immediately wonder about is how to debug in the Universal as a developer? Is the debug screen as we know it in the Windows GUI something that is on the ROADMAP or is some other way of debugging :flashlight: required?
 

I've found a topic about Logging and monitoring 

"We're also working on an integrated debug page for Indicium, where authorized users can get an overview of all requests and generated queries by Indicium.”


What is the status of this development?

icon

Best answer by Mark Jongeling 17 November 2021, 15:49

View original

4 replies

Userlevel 7
Badge +23

Hi Dennis,

To compare the Debug screen of the Windows GUI to that we can do for the Universal GUI, the developer tools (F12) of your browser, you can see every request made to Indicium in the Network tab. This does look different from what the Windows GUI shows but that is due to Indicium working with Odata and JSON and Windows GUI and the database communicate with SQL.

To test, you can use programs like Insomnia and Postman to test Request URLs and see what gets returned. Also the program will show the HTTP status code and with that you most likely can pinpoint the problem.

We do have the Database log in the Universal GUI. If you have sufficient rights you can access it: 

(The database event log can be accessed from the Universal GUI, the root page of Indicium, or by navigating directly to /account/ui/dbEventLog. It requires you to log in with a user that is a Development Mode administrator in IAM)

Universal GUI → Database log


Does this help?

Userlevel 3
Badge +8

The errors in the indicium log barely gives information about the context, where it was triggered, what has caused it to happen etc. For example which http request was it that triggered the error and which function/stored procedure/trigger/systemflow/what the actualy faulty SQL statement was etc… (sure I can gather every single logfile including client action and try to match them all together, but a single indicium log entry that provides such crucial backtrace information is so much more convenient)

Is that something you are looking into also?

Userlevel 7
Badge +23

The errors in the indicium log barely gives information about the context, where it was triggered, what has caused it to happen etc. For example which http request was it that triggered the error and which function/stored procedure/trigger/systemflow etc… (sure I can gather every single logfile including client action and try to match them all together, but a single indicium log entry that provides such crucial backtrace information is so much more convenient)

Is that something you are looking into also?

Making the Indicium log more clear and giving better insights in errors is an ongoing process. Feel free to create Ideas for this as we can take this input to make the logs better usable and readable. There's a backlog item for Indicium to troubleshoot process/system flows.

Userlevel 7
Badge +23

We made a blog about troubleshooting the Universal GUI: Troubleshooting Universal GUI | Thinkwise Community (thinkwisesoftware.com)

Reply