


Have you ever had a system slow down and everybody waiting for you to fix it?
Or wondered what happened in the database an hour ago?
Or been curious what impact a change in your query had to the speed of execution?
Or been confused about how to best monitor database performance?
Let's talk about a way to answer the above questions using the Query Store that is being provided in SQL Server since SQL Server 2016. This is not going to be an in-depth view of all the features of the query store but merely to make you aware it exists, the way I use it and some of the key benefits.
If you are looking for a detailed analysis of the complete feature set, please refer to the Microsoft documentation.
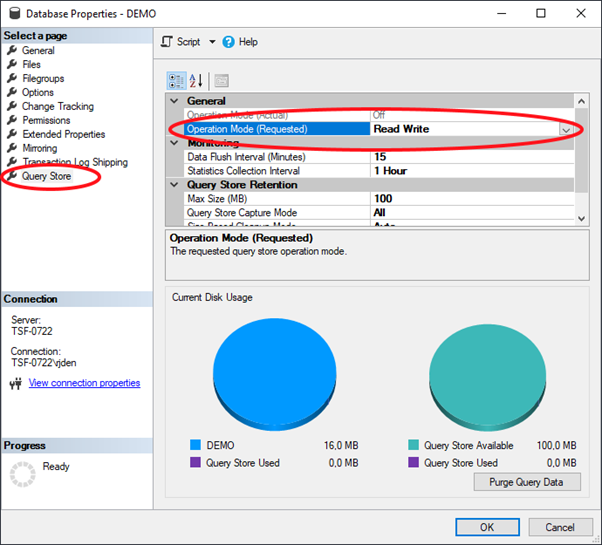
First thing we need to do is enable the query store, fortunately, this is very easy.
- Navigate to database properties
- Select ‘query store’ on the left hand panel
- Set the operation mode of the query store to 'Read Write'
- Click OK
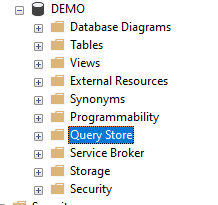
- Hit refresh on your database in the Object Explorer
- Verify there is an extra folder called 'Query Store' within your database
After this, the query store can be used, but please be aware, that it can take some time to build up a representative set of data regarding the performance of your database. Plans are only being logged after the query store has been enabled.
Within the query store folder, there are several options available that provide insight into the performance of your queries. As mentioned, I will give you a brief overview of how I use the query store.
The query store stores a full history of query execution and is able to represent this data in an orderly fashion. It stores information like:
- What queries ran
- What execution plans are associated with this query
- How many times the query has run
- Duration of query execution
- Etc.
The best use of the query store is for constant logging of queries that have run in order to identify performance bottlenecks or regression (performance getting worse over time).
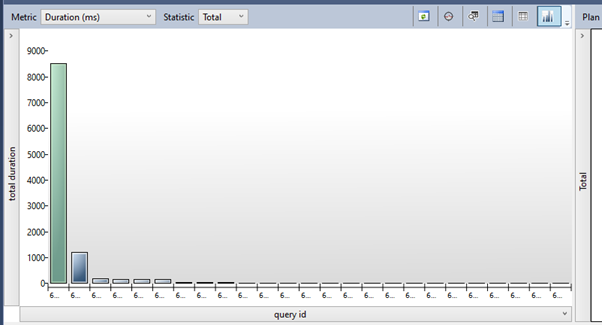
The overview I personally use most is the 'Top resource consuming queries' overview. This overview gives a great insight into what queries are causing performance issues.
Basically, this overview gives you a list of critical queries to look at. You want a fairly level list of bars in the graph. If you have a few queries towering above the rest, look at those first.
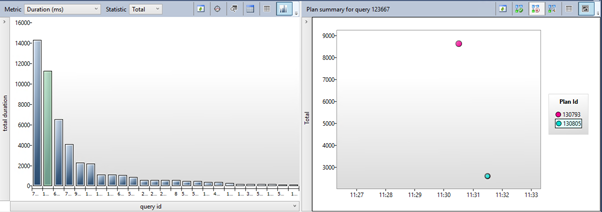
Once you have identified a problem and applied a fix, you can see the plan of the query changing in the pane on the right. In the example below I have added an index, in order to improve the query.
This is represented by a different circle (different query plan) in the right-hand pane.
Since the query store data is (like a lot of things in SQL server) being held in a database, it is possible to query this data directly. You can, for example, find missing indexes based on the plans that have been executed.
Below an example that does just that:
select
 sum(qrs.count_executions) * avg(qrs.avg_logical_io_reads) as est_logical_reads,
 sum(qrs.count_executions) as sum_executions,
 avg(qrs.avg_logical_io_reads) as avg_avg_logical_io_reads,
 sum(qsq.count_compiles) as sum_compiles,
 (
 select top 1 qsqt.query_sql_text
 from sys.query_store_query_text qsqt
 where qsqt.query_text_id = max(qsq.query_text_id)
 ) as query_text,
 try_convert(xml,
 (
 select top 1 qsp2.query_plan
 from sys.query_store_plan qsp2
 where qsp2.query_id=qsq.query_id
 order by qsp2.plan_id desc
 )
 ) as query_plan,
 qsq.query_id,
 qsq.query_hash
from sys.query_store_query qsq
join sys.query_store_plan qsp
 on qsq.query_id=qsp.query_id
cross apply (select try_convert(xml, qsp.query_plan) as query_plan_xml) as qpx
join sys.query_store_runtime_stats qrs
 on qsp.plan_id = qrs.plan_id
join sys.query_store_runtime_stats_interval qsrsi
 on qrs.runtime_stats_interval_id=qsrsi.runtime_stats_interval_id
where qsp.query_plan like N'%<missingindexes>%'
 and qsrsi.start_time >= dateadd(hh, -24, sysdatetime())
group by qsq.query_id, qsq.query_hash
order by est_logical_reads desc
TL/DR
Query store stores executed query plans.
It is able to show what queries (plans) use most resources or take the longest.
It also shows the execution plan, missing indexes and the query executed.
It helps with discovering where performance bottlenecks are or what queries consume most resources.
Therefore, it is a good starting point for analysing performance issues, especially in production environments..
Further reading